V-bottom chart patterns are extremely common, easy to recognize, and reliable but nuanced. Chart patterns are one of the most popular forms of...
Zach
Playing Markets
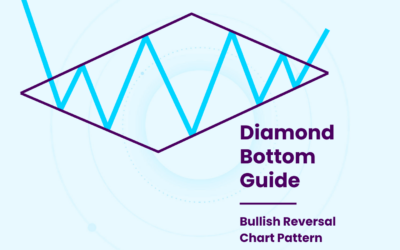
Diamond Bottom
Diamond bottom chart patterns are reliable but fairly rare and nuanced. Chart patterns are one of the most popular forms of technical analysis. ...
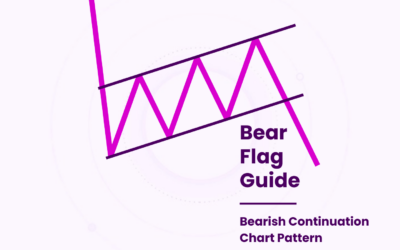
Bear Flag
Bear flag patterns are fairly common, well-known, and reliable. Chart patterns are one of the most popular forms of technical analysis. That’s...

70% Rule
What Is the 70% Rule? The “seventy percent rule” (or, “70% rule” or “70-30 rule”) is a commonly used guideline for real estate investing. It...
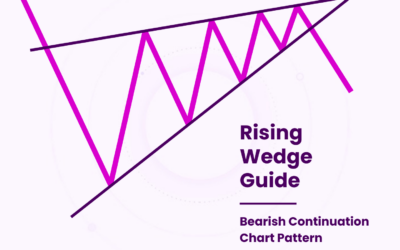
Rising Wedge
Rising wedge chart patterns are common and widely recognized, but nuanced. Chart patterns are one of the most popular forms of technical analysis. ...
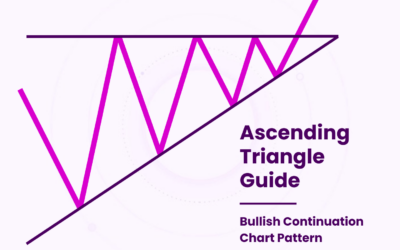
Ascending Triangle
Ascending triangle chart patterns are common, recognizable, and reliable. Chart patterns are one of the most popular forms of technical analysis. ...

50% Rule
What Is the 50% Rule? The “fifty percent rule” (or, “50% rule”) is a commonly used guideline for real estate investing that recommends that...

2% Rule
What Is the 2% Rule? The “two percent rule” (or, “2% rule”) is a real estate investing guideline. It recommends that monthly rent should be set at...
Accumulation
What Is Accumulation? In trading and investing, accumulation is the act of acquiring more of an asset over a period of time, usually across the...

1% Rule
What Is the 1% Rule? The “one percent rule” (or, “1% rule”) is a commonly used guideline for real estate investing. It recommends that monthly rent...

Downside Gap Three Methods
Downside gap three methods patterns are a lesser known but easily recognized candlestick pattern. Learning how to read and trade them adds a...

Upside Gap Three Methods
Upside gap three methods patterns are a lesser known but easily recognized candlestick pattern. Learning how to read and trade them adds a valuable...