Smart choice.
Candlesticks charts are the most popular way to graph price action.
They can tell you a lot about the behavior of an asset. Plus, they are the foundation upon which most trading tools are built. Luckily though, candlesticks themselves aren’t all that complicated.
First though, let’s start with a definition.
What Are Candlesticks?
Candlesticks (aka “candles”) are graphical representations of price within a given time period. Each candlestick is made up of a wide part (known as the “real body” or “candle”) and two thin parts (known as “shadows” or “wicks”). Together, these represent the opening price, closing price, highest price, and lowest price.
When looking at a candlestick price chart, time is on the x-axis and price of the asset is on the y-axis.
Each candlestick is the same width because they represent equal measures of time. The difference between them comes in the vertical length and positioning of their bodies and shadows. Candles can be long or short. They can also have long wicks or no wicks at all.
The shape and size of a candle can tell you a lot about price action during that time period. We will dive deeper into that in a moment.
First though, let’s talk about where candlesticks came from.
History of Japanese Candlestick Charts
Candlestick charts are thought to have been developed in the 1700s in Japan by rice trader Honma Munehisa.
Honma used his candlestick charts to visualize the price fluctuations of rice. Each part of his candle represented a different aspect of rice prices. We now know these as the open, close, high, and low.
He didn’t have all of the sophisticated indicators using advanced calculus we have today. Yet, these basic candlestick charts helped him become one of the most successful traders in history (though they were but one of his tools).
Using his findings, Honma was able to increase his own profits. The data he kept helped him avoid potentially risky trades while taking advantage of market lows.
Candlesticks were brought to the West by Steve Nison in his book Japanese Candlestick Charting Techniques. Since then, they’ve become a mainstay in every traders’ arsenal.
How Japanese Candlesticks Work
In modern trading, it’s easy to get ahead of yourself.
There are so many “gurus” out there trying to sell you some indicator or signal service.
But it is absolutely essential that you have a firm grasp on the basics. Understanding how to read Japanese candlesticks is one of those fundamental skills every trader should master.
Most of the fancy indicators and other tools are based on candlesticks anyway.
Components of a Candlestick
As mentioned above, each candlestick has three main parts.
- Real body – The difference between the opening price and the closing price. This is illustrated with the wide part of the candle.
- Upper shadow – The difference between the high price and the opening or closing price, illustrated with a thin vertical line extending upward from the candle body to the high.
- Lower shadow – The difference between the low price and the opening or closing price, illustrated with a thin vertical line extending downward from the candle body to the low.
By default, most trading platforms use green for bullish candles and red for bearish ones.
When the closing price is higher than the opening price, we call a candle “bullish.” Basically, the price went up over that time period. When the closing price is lower than the opening price, we call a candle “bearish.” Basically, the price went down.
However, a single bullish or bearish candle does not make a bullish or bearish trend. Nor, does a single bullish or bearish candle predict that the next one will be the same. In fact, the shape of the whole candlestick tells you more about what may happen next than does the color of the candle.
With this in mind, many traders change their candle bodies to neutral colors (or none at all). The idea is that the colors green and red are loaded with psychological impact. Using them is counterproductive because it puts emphasis on the wrong thing. Whether a single candle closed higher or lower than it opened is less important than the shape of the candle.
Shortly, we’ll expand this conversation to elaborate on some of the different candlestick shapes and what they may indicate.
First though, let’s make sure we’re painting a clear picture.
How To Read Candlestick Charts
As you can see:
The exact shape of a candlestick is never certain until the time period is over. Once the period ends, the body is locked in. Most of the time, the next candle opens at the same price that the previous one closed at. (When it doesn’t, price action may create a “gap.”)
You can’t read too much into candles until they are complete. That’s because they are only ever an illustration of what has happened in the past.
You need other things to put them into context.
One of those things is other candles. With one candle, you can see a brushstroke. With enough candles you can see the whole canvas.
That’s part of the reason signals from candlestick patterns and chart patterns are seen as so much more reliable than those from individual candlesticks.
However, that’s not to say single candlesticks have nothing to tell you.
In fact, they have plenty.
What Individual Candlesticks Mean
As we’ve stated:
Candlesticks give you four basic pieces of information about price action over a given timeframe.
These are:
- The opening price – The price at the beginning of the time period.
- The closing price – The price at the end of the time period.
- The high price – The highest price during the time period.
- The low price – The lowest price during the time period.
But a single candlestick can tell you other things with just a glance.
- The longer the candle body, the larger the difference between the opening and closing prices.
- The range from wick tip to wick tip represents the total range of price action during that time period. Larger ranges indicate greater volatility.
- Certain candlesticks (or candlestick formations) may signal potential reversal, continuation, consolidation, or other impending market conditions.
Don’t let it overwhelm you. Seeing these relationships will become second nature to you once you’ve spent enough time looking at the charts.
With enough exposure, the different shapes will begin to jump out at you.
Types of Candlesticks
Not all candlestick shapes deserve names.
However, certain structures have become “famous” for appearing at pivotal moments in the market or other points of interest.
Of course, no single candle can tell you anything too specific alone. But some shapes may be a sign that it is time to pay closer attention to certain things.
It is also worth noting that certain candlestick types may be more or less common depending on the asset, time period, and/or other factors. The more you look at the same asset over the same time frames, the more familiar you’ll become with what types of candlesticks you can expect from that combination.
You can learn more about all of the candlestick types in our post on it.
Here, we’ll touch on a few of the interesting ones to help you get a feel for some of the things you may want to look for.
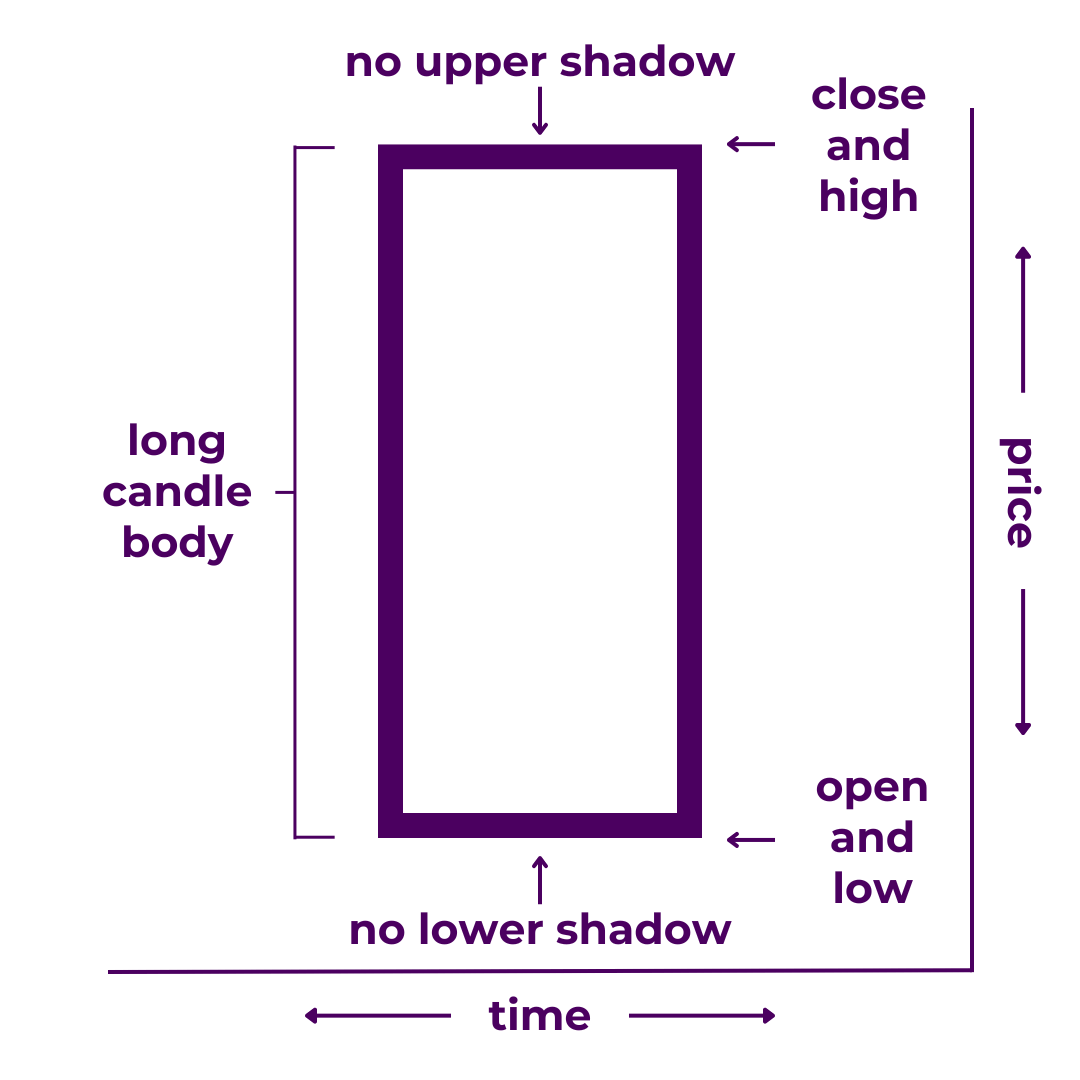
Marubozu
A marubozu is a long candlestick without shadows.
It indicates that the open and close prices are the same as the high and low prices (or vice versa), and cover a large trading range. In trading terms, a marubozu candle signals dominance.

A marubozu candlestick paints a picture of overwhelming momentum. On the chart, it looks like non-stop price movement for an entire period. Without any wicks, the color of the candle always stands out. Bullish marubozu scream, “To the moooon!” Bearish ones wail, “Going doooown!”
Marubozu candlesticks are a subtype of long candlesticks. They show that price rose or fell greatly burning the time period of the candle. They are seen as a sign of powerful buying or selling pressure that appear during trending moves, reversals, and periods of high volatility.
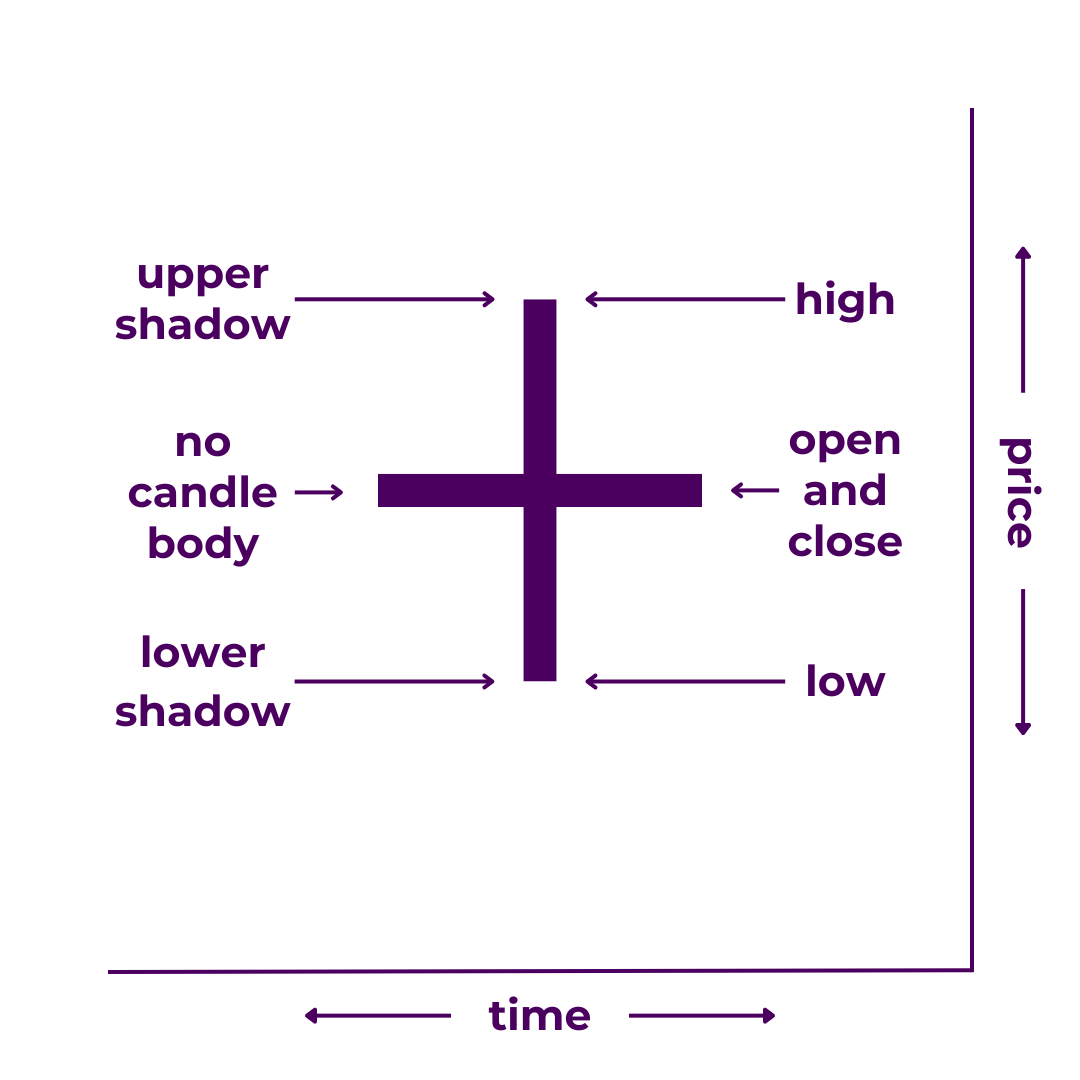
Doji
A doji is a candlestick without a real body.
It indicates that the open and close prices are the same, regardless of the total trading range. In trading terms, a doji candle signals indecision.

A doji candlestick paints a picture of a crossroads. Without a candle body, the trading range (wick-to-wick) usually stands out most. On the chart, it looks like a price action tug-o-war. Some doji do give a directional bias. However, most of them send the message that “it could go either way.”
There are several subtypes of doji candlesticks, including dragonfly doji, gravestone doji, and long-legged doji. Each of them show that price opened and closed at the same level, however their wicks can give indication of a potential directional bias. They often appear during market indecision, reversals, trending moves, and periods of high volatility.
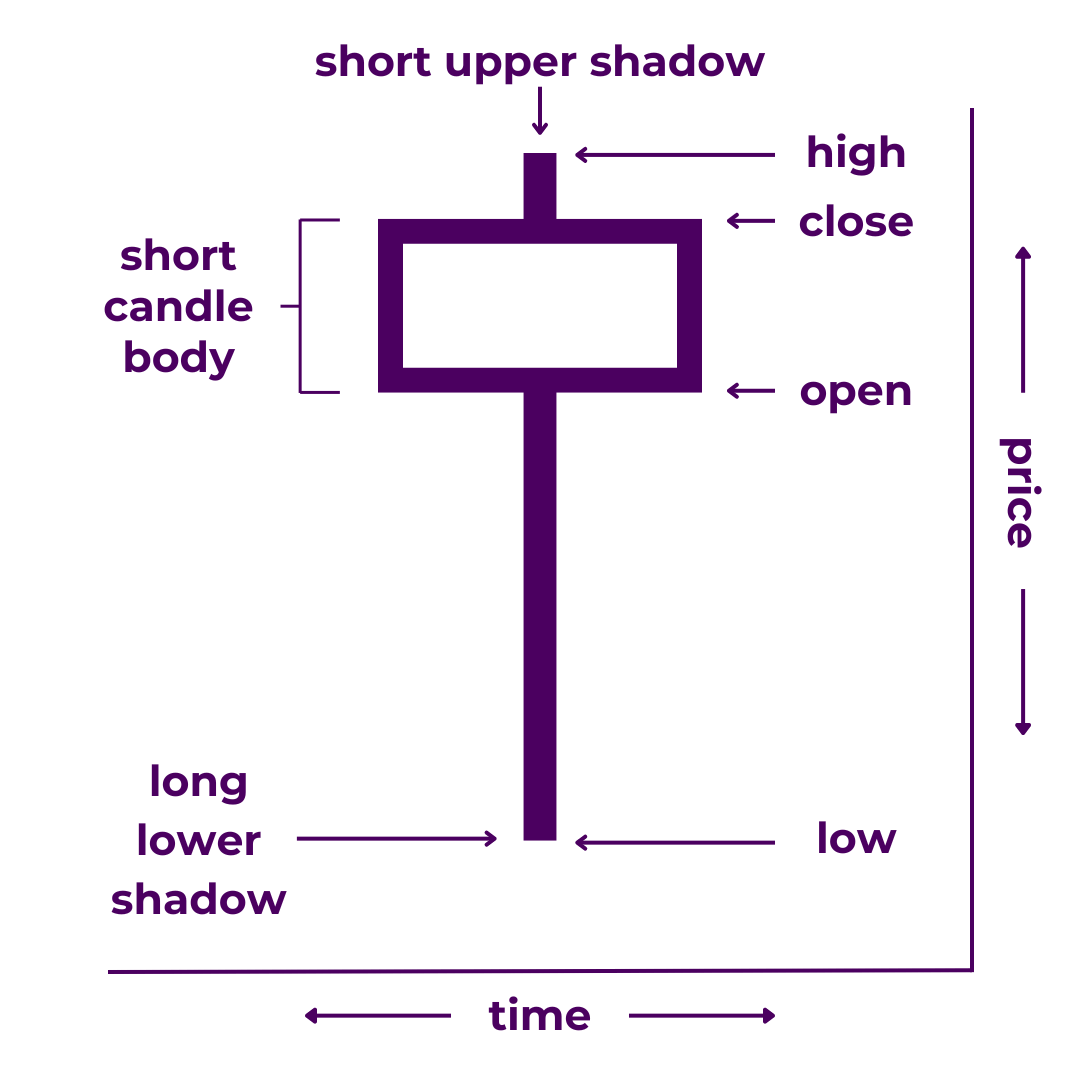
Hammers
A hammer is a candlestick with a short real body, little to no upper shadow, and a longer lower shadow.
It indicates that the open and close prices are close together and near the top of the trading range. In trading terms, a hammer candle signals that the bulls may be gaining strength.

Hammers paint a picture of a trend running out of steam. With a short body, the long lower wick usually stands out most. On the chart, it looks like the bears attempted to push prices lower but the bulls said, “Not so fast.”
Hammer candlesticks demonstrate back and forth price action. They show that price drove lower then bounced back up within the time period of the candle. The hammer candlestick is often considered a sign of potential reversal, as are its cousins, the hanging man, the inverted hammer, and the shooting star.
How To Make Money with Candlesticks
Now you should have a strong understanding of how candlesticks work.
It’s time to start talking about how to make money.
Unfortunately, profitable trading requires more than just the ability to interpret candlesticks. Candlesticks give you a good (yet imperfect) idea of what happened within a given time frame. Yet very few of them are all that exciting by themselves.
You need more to see the full picture.
(What? You didn’t think you could become a profitable trader overnight did you?)
You still have several skills you need to master—and experience you need to gain.
Be grateful though, there’s still soooo much more the charts want to tell you.
Reading the Story in the Charts
First, learn how to flesh out your chart narrative.
Candlesticks are like a basic outline. The goal is to create a more complete story of price action. That way, you can make more informed trading decisions.
Traders and investors who favor fundamental analysis make decisions primarily based on factors such as the economic environment, a company’s profit and loss statement, and changes to industry regulations. In essence, they buy and sell based on the real-world narrative surrounding a given asset.
Here, we want to do something similar, but more do so in trading terms.
You develop these ideas with other skills and tools.
- Learn Candlesticks. Japanese candlesticks are the most popular graphical representations of price action used by traders. For most, they are the basis of all technical analysis.
- Learn Candlestick Patterns. Candlestick patterns are formations of more than one candlestick that often appear at inflection points in price action.
- Learn Chart Patterns. Chart patterns are even larger patterns formed over the space of many candlesticks, meaning they may have even more significant implications.
- Learn Cycles, Levels, and Trend. Assets go through cycles, as does the wider market. Within these market cycles exist important price levels and shorter-term trends.
- Learn Chart Markup. Modern trading platforms give you an array of drawing (and other) tools that markup your charts with, highlighting patterns, levels, trends, and more.
- Find Indicators You Like. There are dozens of popular tools known as “indicators” you can use to supply additional information to your analysis. You can even create your own custom ones.
- Understand Your Asset. Assets move in their own unique patterns. Find an asset you’re interested in and familiarize yourself with the way its price moves.
- Choose Your Time Frame(s). The time frames you choose to trade over have a massive impact on your style of trading, as well as your risk:reward profile.
From here, you need practice.
Time studying the charts is the only way to turn theoretical concepts into practical knowledge.
Now, you’ve reached the cusp of making consistent money as a trader.
Creating (and Executing) a Profitable Trading Strategy
This is where you go from knowledge to action.
As a trader, your job is not to predict the future. It is to weigh probabilities. You analyze what has happened in the past for hypothesizing, not prophesying.
From there, you come up with plans (and contingency plans) according to potential outcomes.
How do you do that?
- Learn the (Basic) Math. Growing by percentage takes some getting used to. Luckily, you only need to understand the basics of the math; your trading tools can handle the rest.
- Understand Order Types. There are a variety of different ways to place orders on the market. Learn how to execute orders on your trading platform of choice.
- Develop Your Edge. There are an infinite number of potential winning trading strategies. So come up with trading ideas. Then: Backtest! Backtest! Backtest!
- Learn How to Manage Risk. This is how you turn good strategies into profitable trades. Knowing how to get in and out of the market may be trading’s most important skill.
- Master Your Psychology. If you want to be able to win consistently, you have to remove the emotions from your trades. Set rules and stick to them.
- Consider Options. Learn one of the preferred trading methods of professional traders. Gain access to advanced order types and risk mitigation strategies.
- Consider Automation. You can translate your most profitable strategies into code that executes your orders automatically. This opens another world of possibilities.
Yes, trading requires a special set of skills.
You probably won’t become consistently profitable for a year or more.
Who cares?
It’s still worth it.
Trading is arguably the fastest and most direct path to financial freedom. It really does have the potential to change your life. And if luck is on your side, you might even make money while you learn.
Few other vocations can offer you that.
Takeaways
So, now your feet are officially wet.
It begins with familiarizing yourself with the jargon. Then you familiarize yourself with the charts themselves. And finally, you familiarize yourself with executing trades.
Candlesticks are the most popular means of charting price for a reason. That’s why we’ve covered pretty much everything you’d ever want to know about them.
If you need to review:
- Where Candlesticks Come From
- What the Components of a Candlestick Mean
- How To Read Candlesticks
- The Different Types of Candlesticks
- How To Make Money with Candlesticks
From here, just continue learning.
Have questions or more information to add? Contribute to the conversation in the comments below! Or, if you know someone who could benefit from this post, share it with them. Once you’ve understood this post and reviewed our Candlesticks List, you’re ready to progress to Candlestick Patterns.
