Ascending triangle chart patterns are common, recognizable, and reliable.
Chart patterns are one of the most popular forms of technical analysis. That’s not surprising, considering how easy they are to understand and trade. Not to mention, they work with virtually all tradable assets.
In this Ascending Triangle Pattern Trading Guide, we’ll dive DEEP on:
- How They Work
- What They Mean
- Components & Criteria
- Where They Fit
- Their Psychology
- How To Chart Them
- How to Trade Them
- Similar Chart Patterns
First, let’s start with the basics.
What Is an Ascending Triangle Chart Pattern?
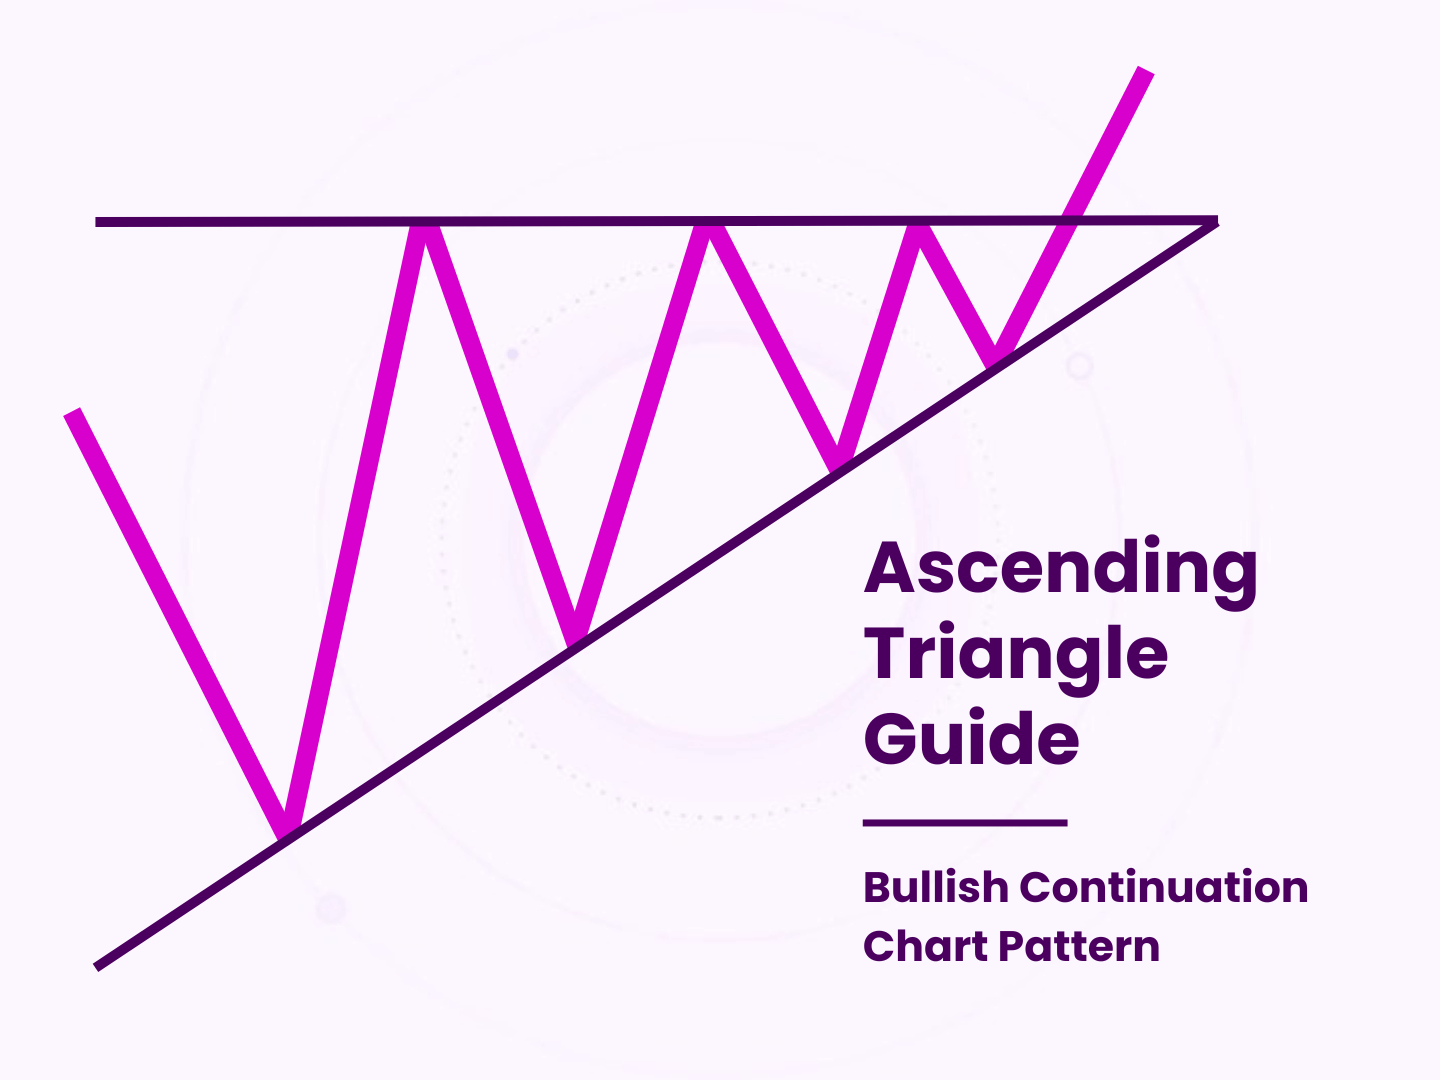
An ascending triangle is a bullish chart pattern that consists of an ascending support line and a horizontal resistance line. Price consolidates between a series of higher lows and repeating highs. It implies a bullish bias and is most commonly used as a continuation signal.
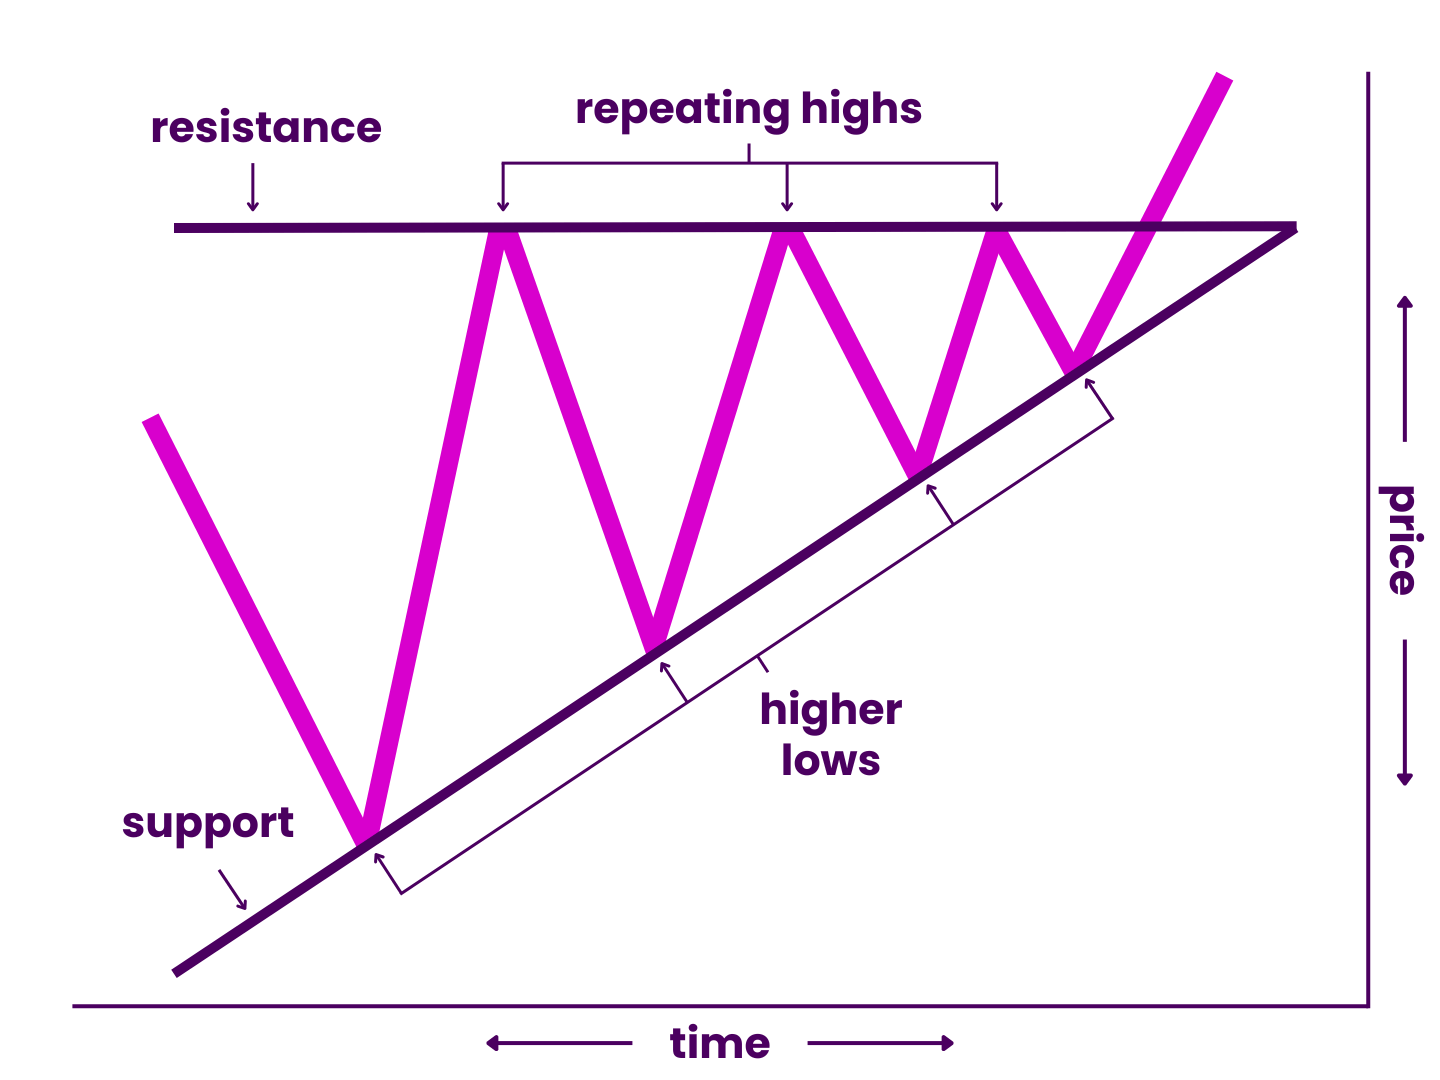
Naturally, the ascending triangle is similar to other triangle patterns (and is the opposite of the descending triangle). It also has overlap with the rising wedge and bearish pennant.
As with all chart patterns, they are more a suggestion than promise. You should never look at them as guarantees!
However, they can still help you make money if you know how they work.
How Ascending Triangles Work
Ascending triangles arise due to a common scenario.
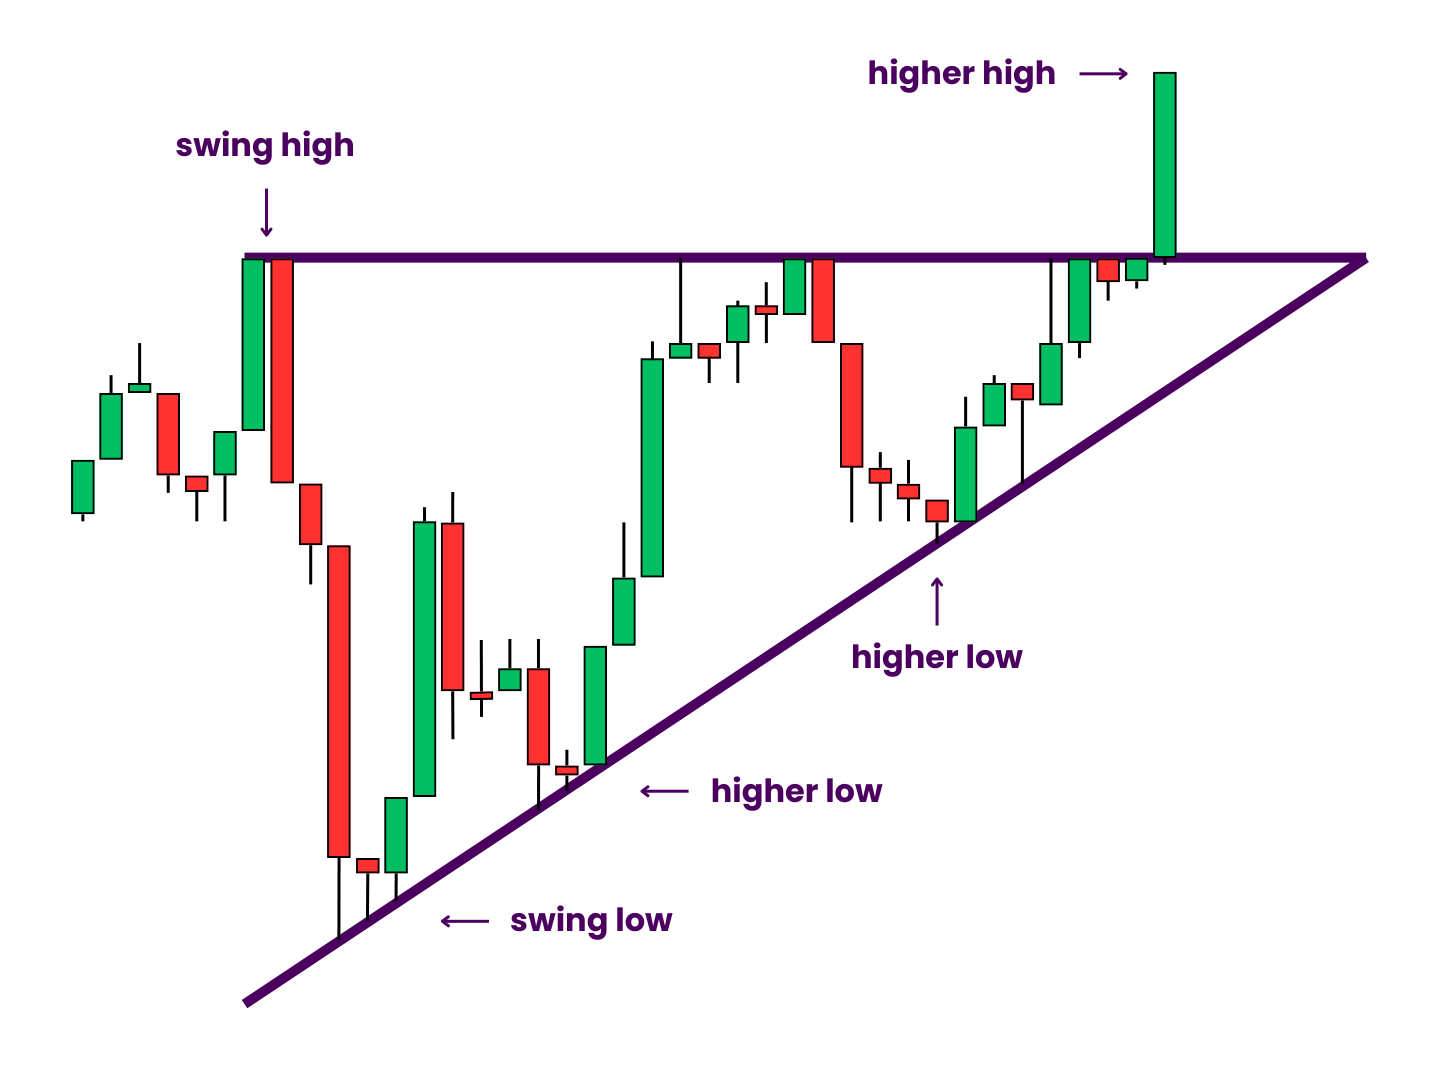
They begin when price falls dramatically from a swing high.
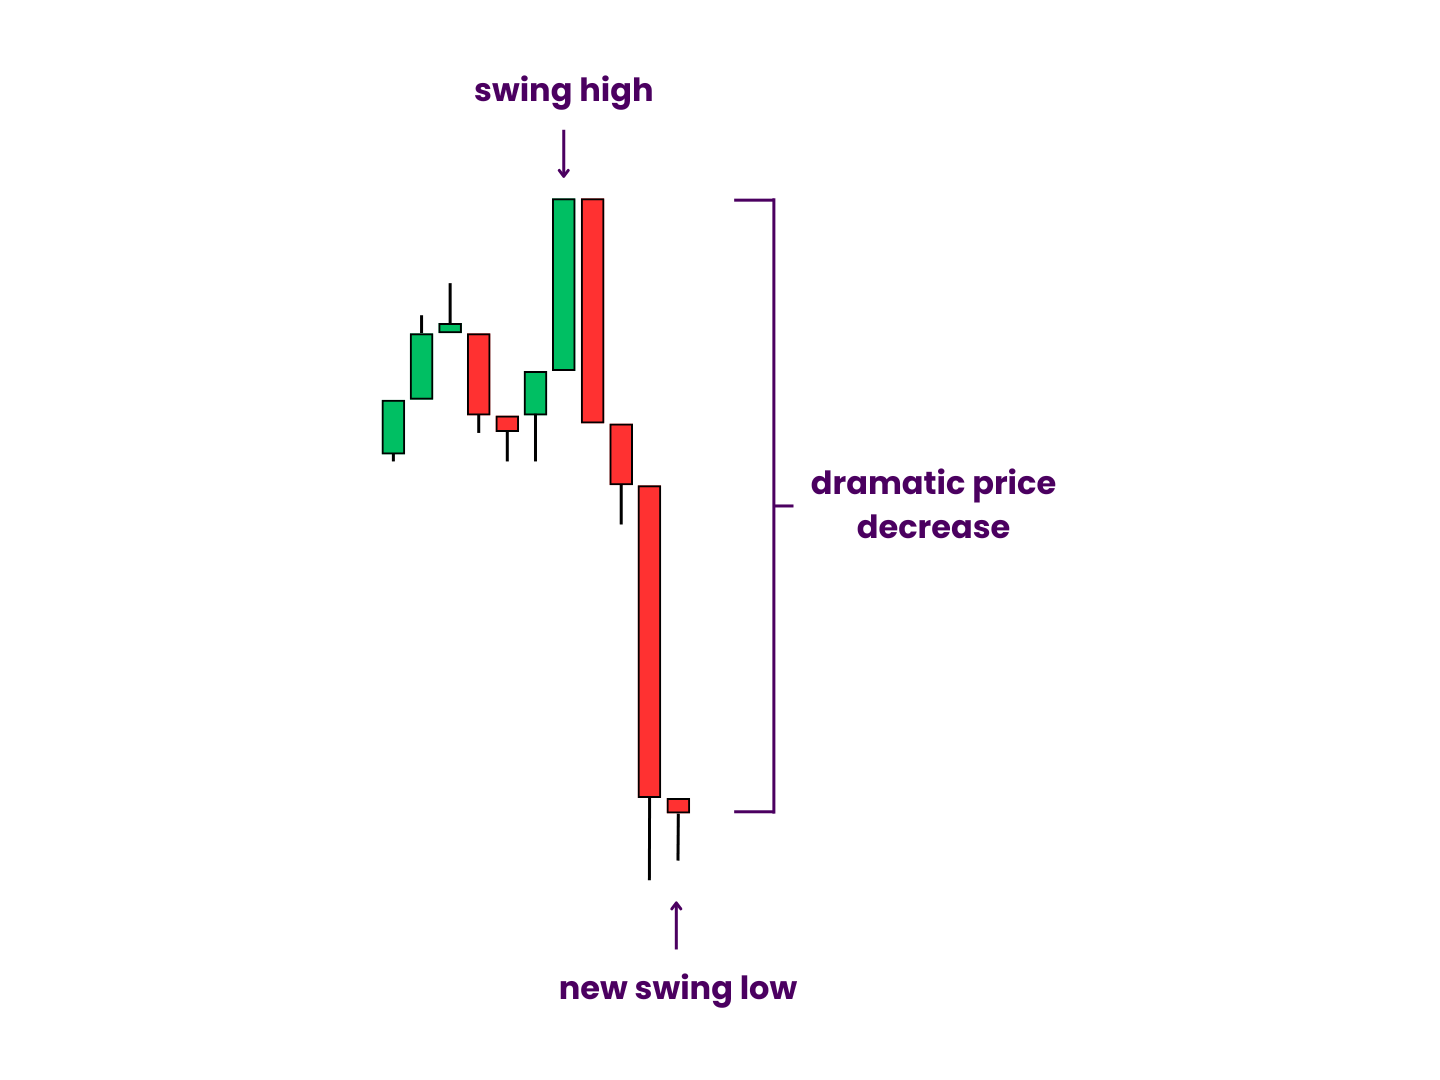
It rebounds shortly thereafter, and eventually rises back to the former swing high. It falls again, but this time, not quite as low as the previous time. The next time it rises, it tests the prior swing high before falling again.
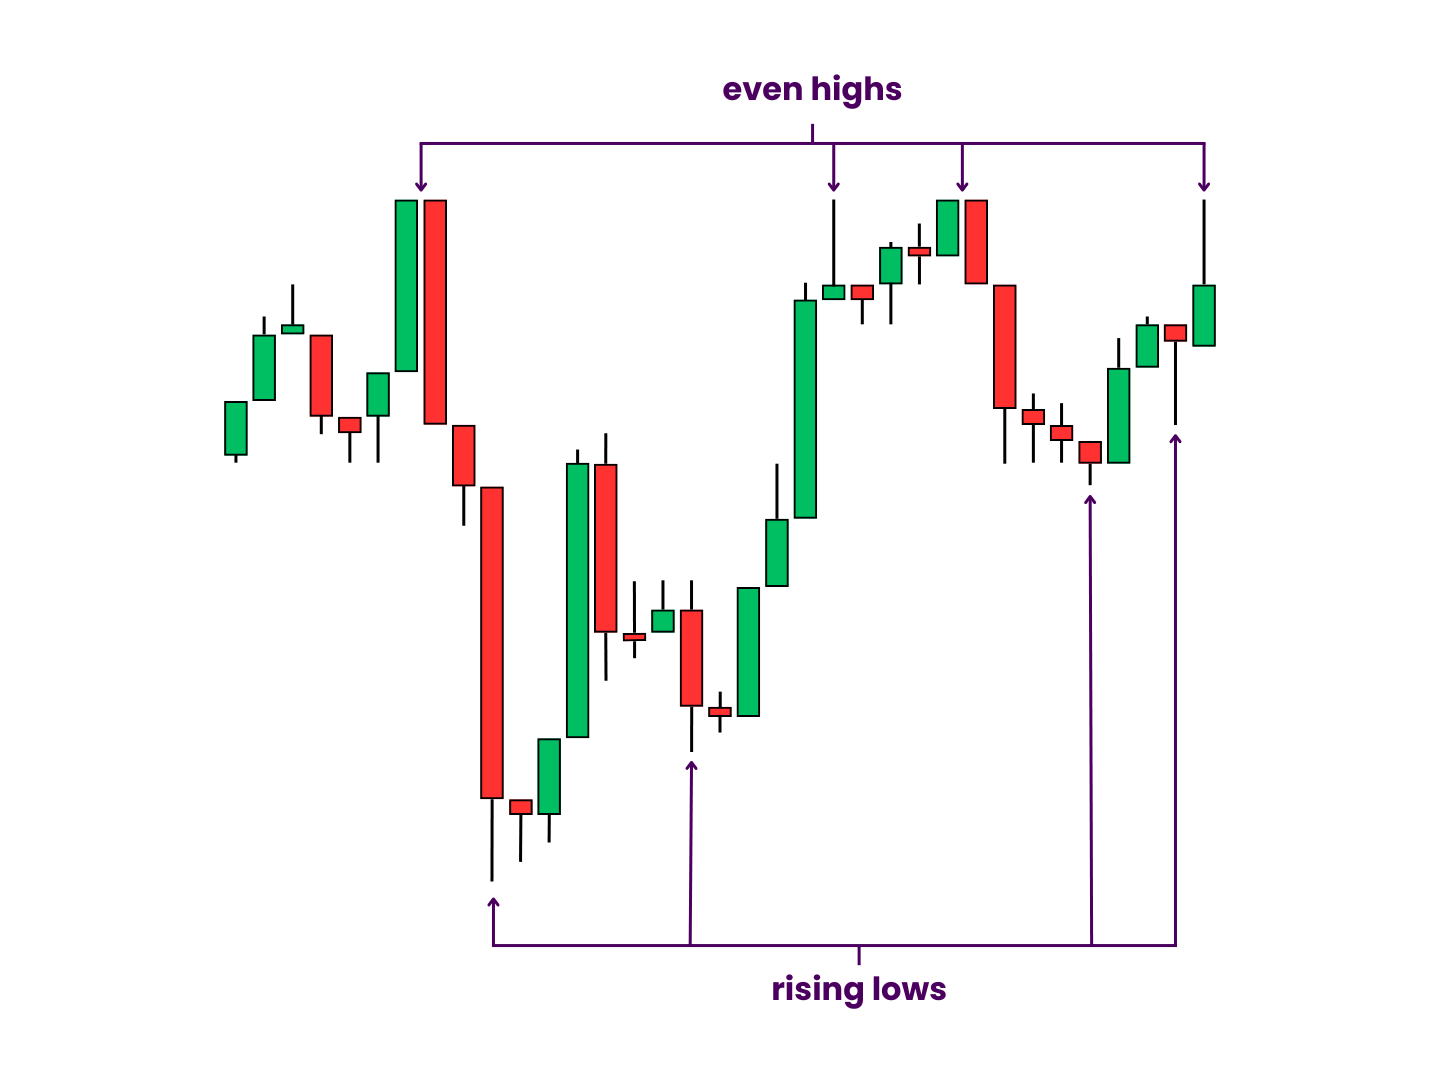
This happens repeatedly, in such a way that you can draw a horizontal resistance line along the peaks and an ascending support line along the valleys. Connect the trend lines at their thickest to complete the ascending triangle shape.
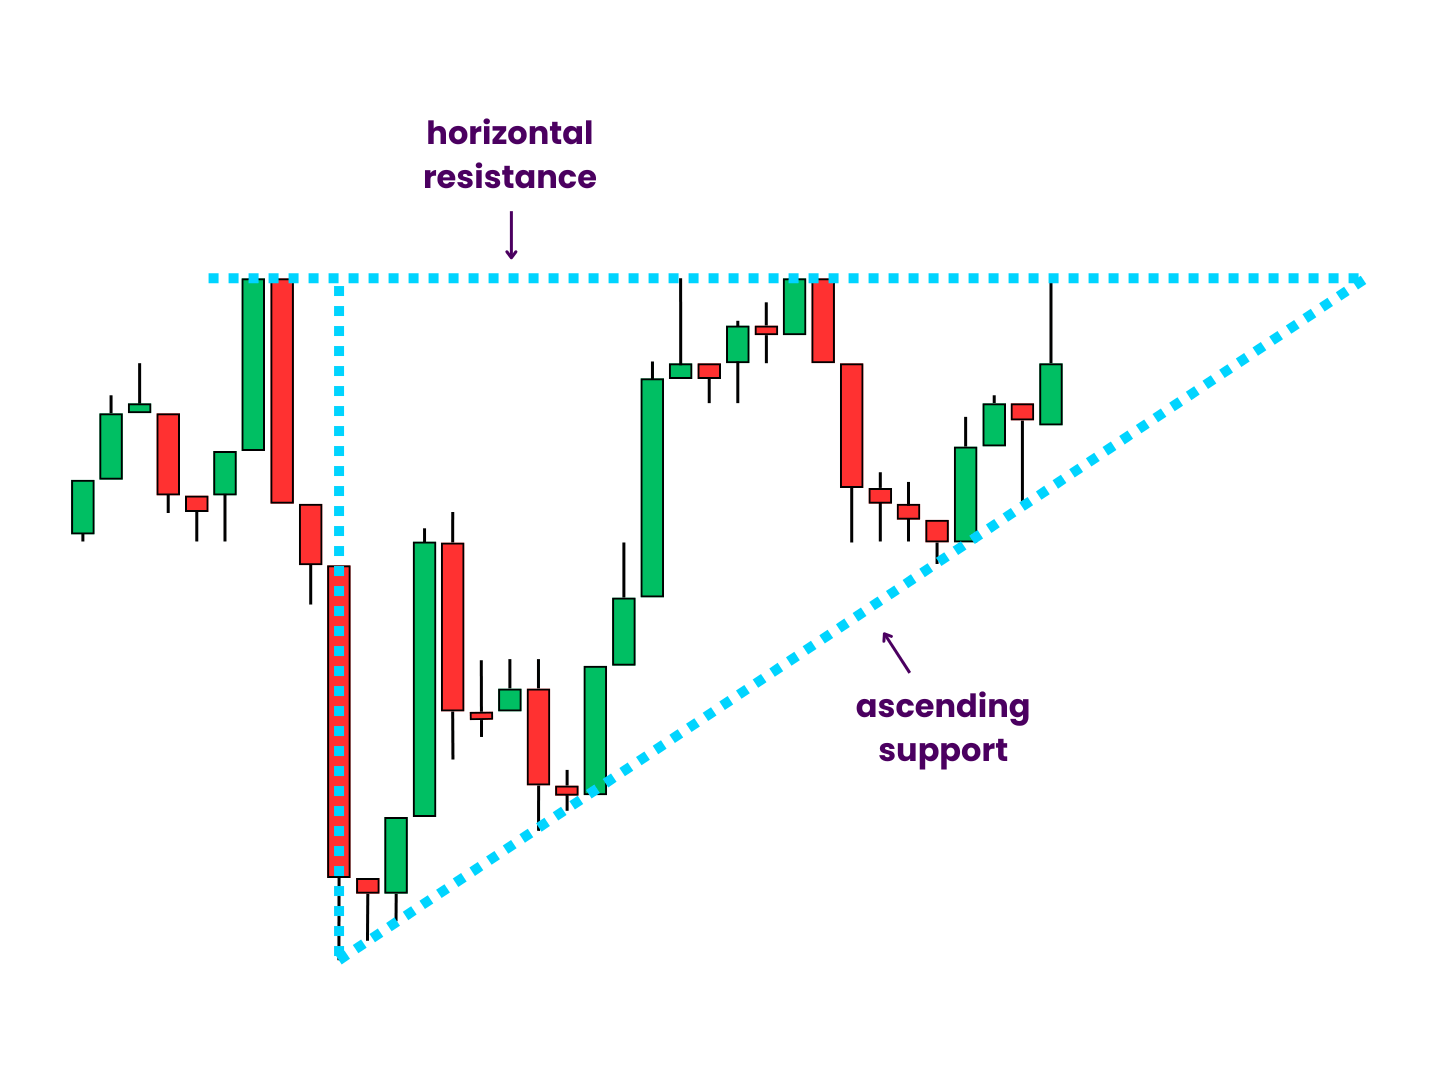
The ascending triangle can also begin with a swing low instead of a swing high. In this case, the support line begins to develop before the resistance line.
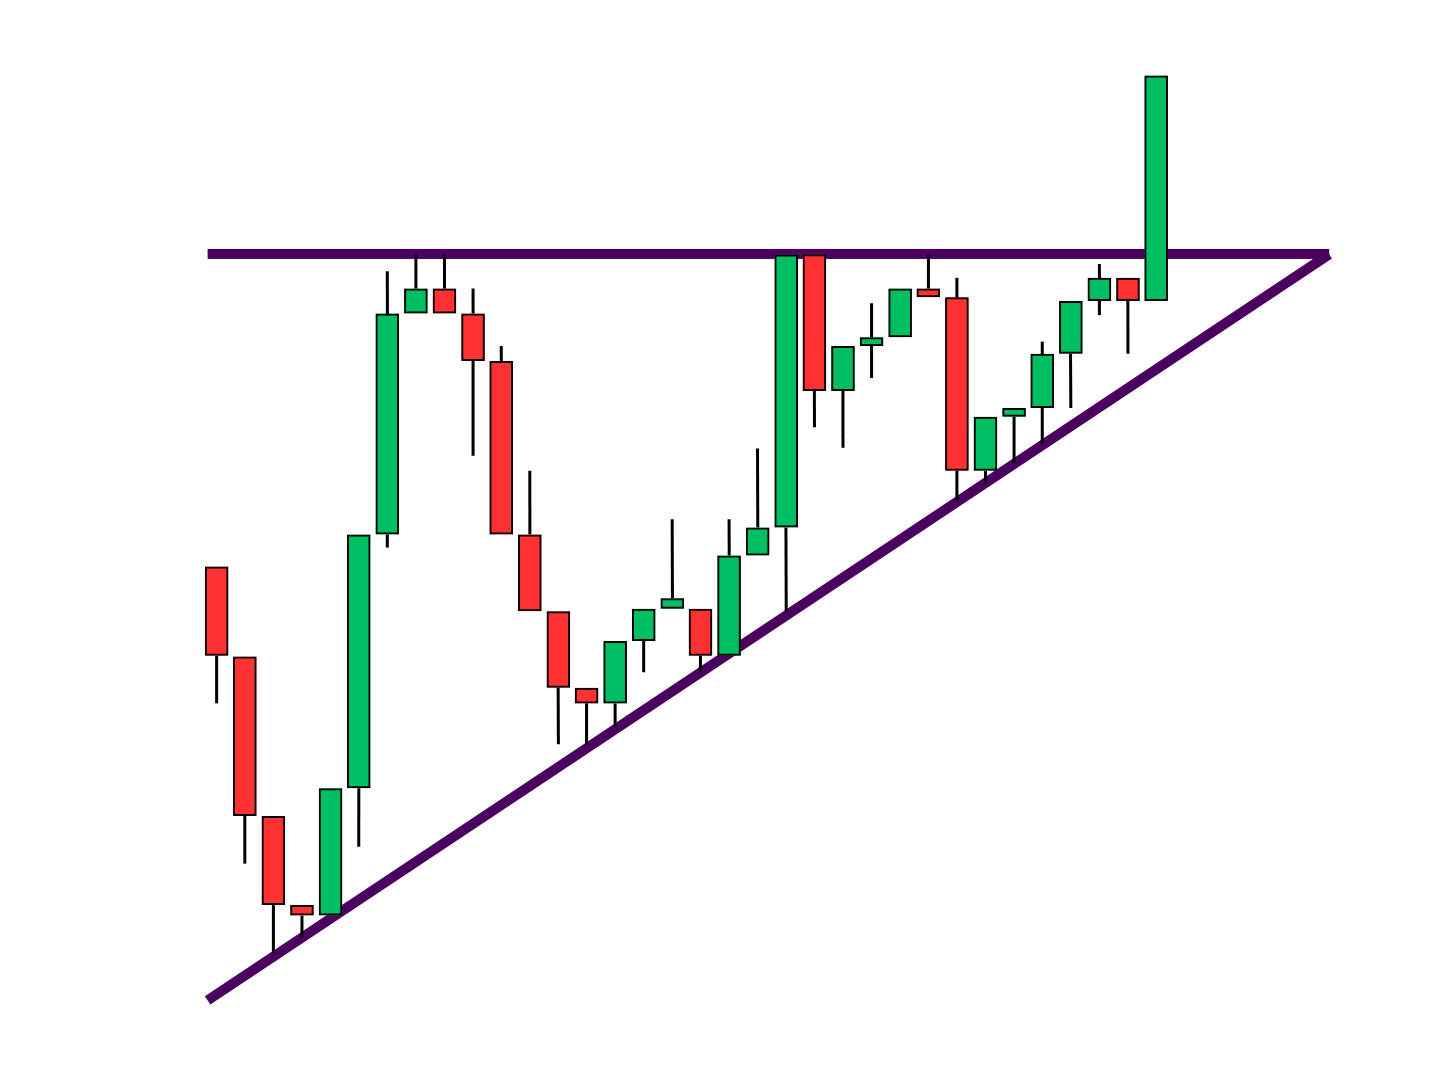
As with all triangles, a candle close outside the pattern sets up a breakout trade in that direction.
You can trade ascending triangles in stocks, forex, cryptocurrency, and most other markets. They appear across a variety of time frames. And they are very easy to see on the chart. No wonder beginner traders are so attracted to them.
This begs the question, then, what do they actually mean?
What Ascending Triangle Signals Mean
Ascending triangle patterns represent a period of accumulation.
In other words, more buyers are acquiring new positions in anticipation of higher prices. As they enter the market, their orders prop the price up. Some take profit as price nears established resistance. Over time, their activity leads to a series of higher lows, one of the two standard conditions for an uptrend.
If the bulls are able to generate enough buying pressure, they can satisfy the second condition (higher highs) as well.
As the ascending triangle pattern continues, volatility contracts and price consolidates. But that won’t last forever. Eventually, all that pent-up energy will have to be released.
Ascending triangles are consolidation patterns that form during uptrends most often. When they do, they tend to signal continuation. They form less frequently during downtrends, but may signal reversal (and perhaps even form longer-term bottoms) when they do.
They are a classic bullish chart pattern, after all.
In this way, successful ascending triangle patterns imply a bullish bias irrespective of other market conditions. They show demand growing against supply within an ever-tightening range. More often than not, they play out as accumulation patterns, with the bulls coming out on top.
Before you can identify ascending triangles, however, you need to understand their makeup.
So let’s take a look at how they are made.
Ascending Triangle Pattern Components & Criteria
Ascending triangles have several parts.
Some remain static (or at least should remain static) throughout the pattern. Others develop as price changes over time.
Most components have specific criteria. Some of these are seen as guidelines. However, several of them are absolutely mandatory. If these conditions are not met, then the ascending triangle is invalid. It loses all supposed predictive power. The price targets should be disregarded. The trend lines are then the only things that may still hold some weight.
Therefore, it is crucial you make sure all the pieces are in the proper place.
Resistance Line
The upper trend line acts as a price limit, the proverbial “line in the sand” drawn by the bears. It is a flat line, with price testing the same level over and over again. If price breaks out above the pattern, it will become support.
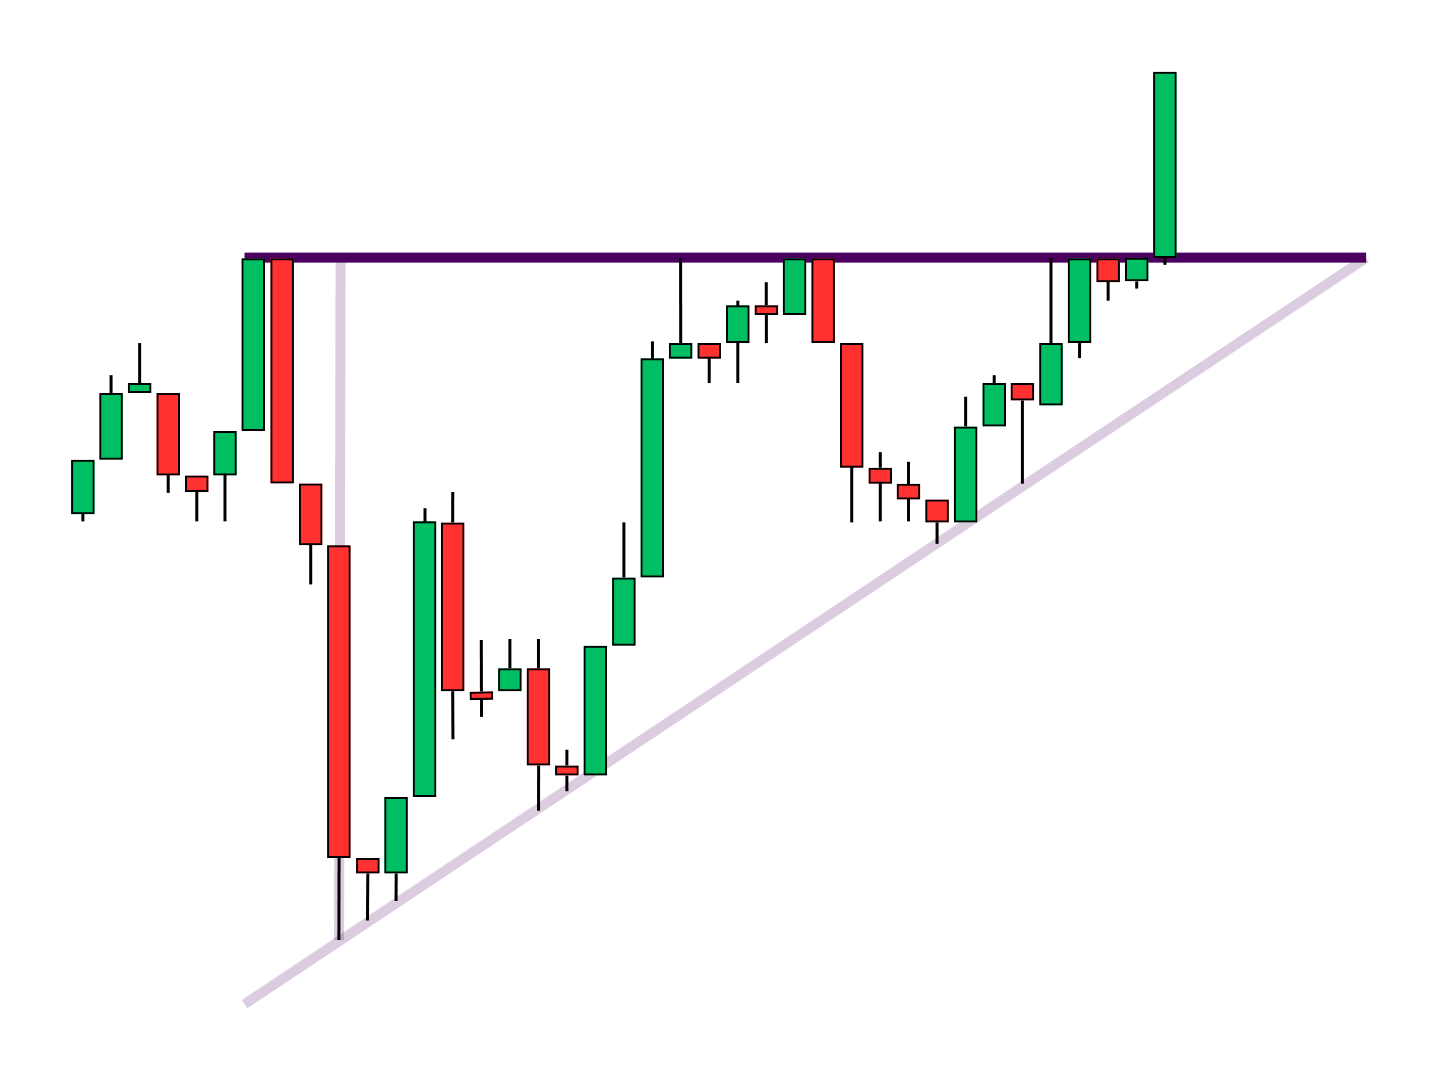
Criteria: The resistance line should be horizontal and connect at least three reaction highs. Some traders may allow for the slightest incline or decline. Others may trust the line after only two touches.
Support Line
The lower trend line holds price up, putting pressure on the sellers. Each time price tests it, another higher low is set. Its angle sets the pattern’s ultimate time limit. Don’t immediately erase it after the breakout either. It may provide support down the road.
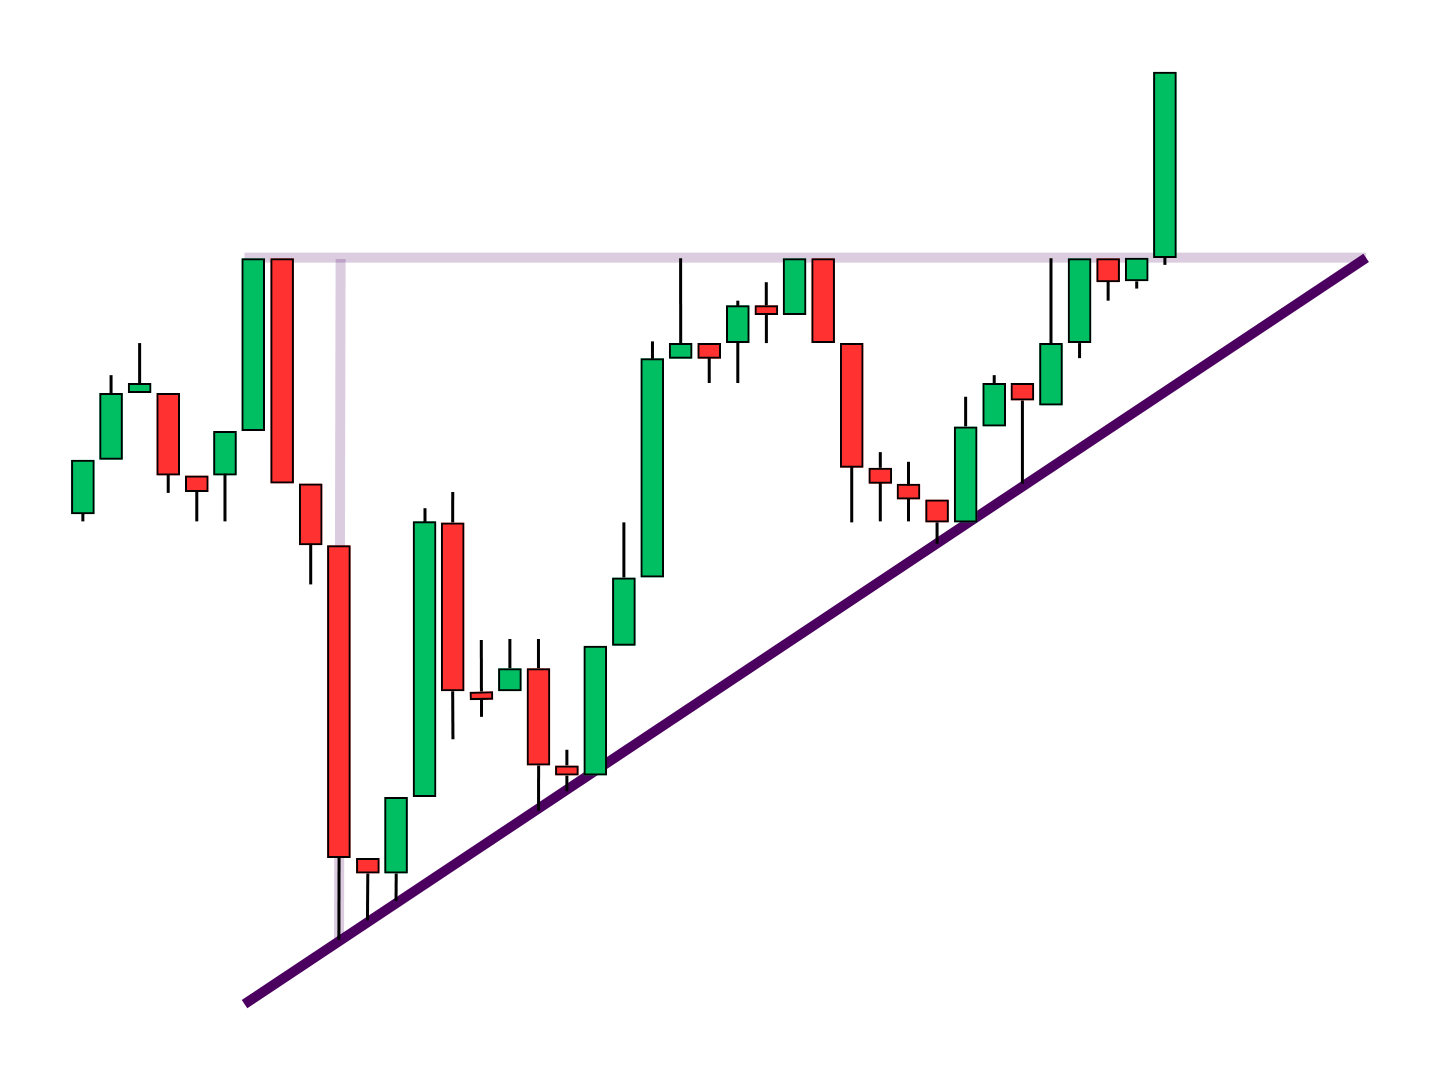
Criteria: The support line must have a positive slope and connect at least two swing lows. Ideally, you’d prefer to see a third touch (especially if the resistance line only has two).
Pattern Height
This line represents the distance between the top of the pattern and its first low. Its exact height will be affected by how you place your main two trend lines. So do so carefully. Appreciate it for both the numerical price range and the percentage it represents. After all, its length will determine the price target.
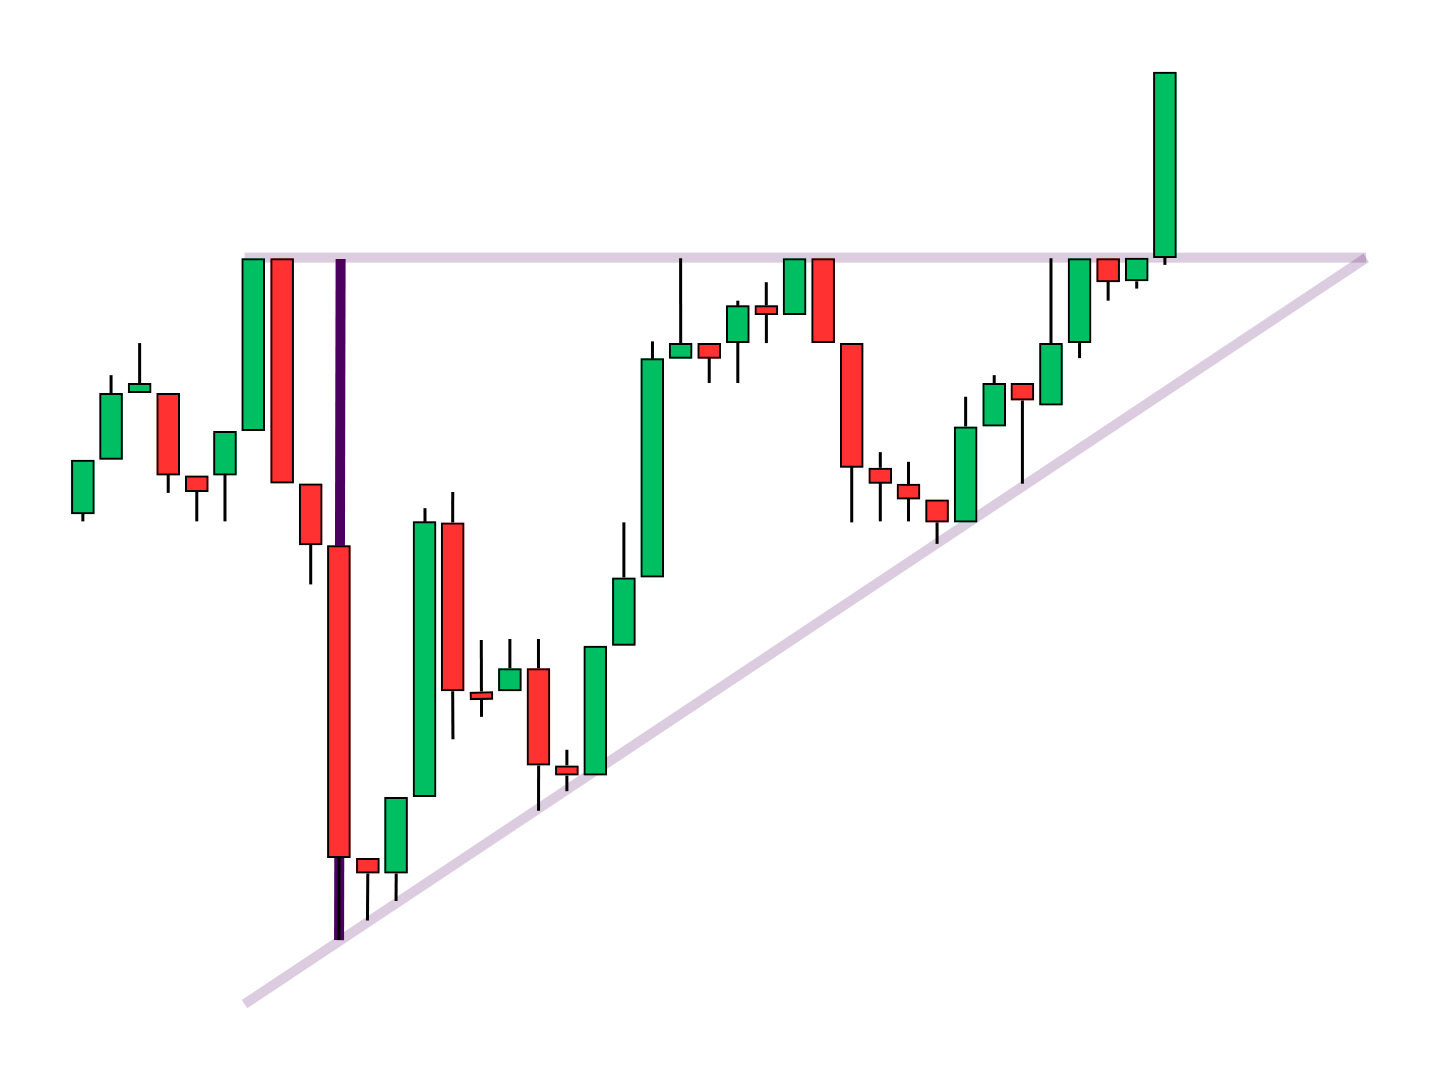
Criteria: The pattern height line must extend vertically from the pattern’s first low to the horizontal resistance line.
(Projected) Apex
The intersection of the trend lines is the “end” of the pattern. However, 99.99% of triangles will see a breakout or failure before price ever reaches this point. Many of them see a resolution when they are 60–70% “full.” Conventional wisdom says that breakouts grow more violent as triangles grow more full (though this does not necessarily imply a more aggressive price target).
Price Target
The price target predicts the price’s post-breakout destination. To find it, add or subtract the triangle’s height from the breakout point. By this rule, taller ascending triangles have larger targets. Bullish targets will always be the same price, no matter when the break occurs. Bearish targets rise over time, with the ascending support line.
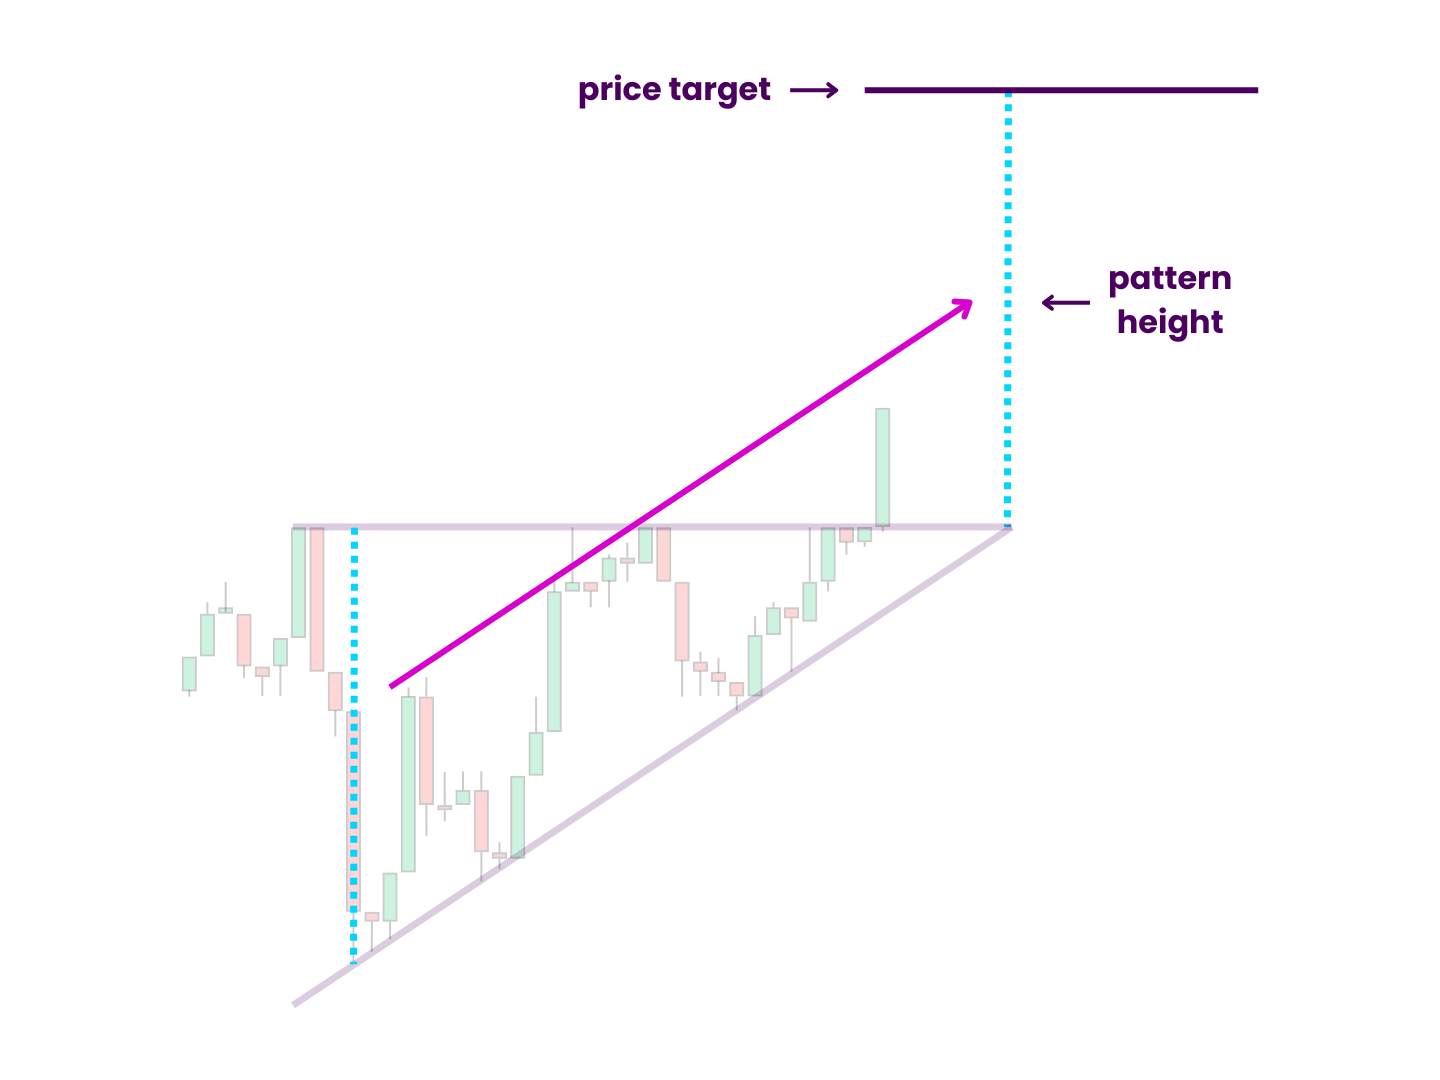
Example: An ascending triangle has a total range from $8.00 to $10.00, giving a $2.00 price target. The upward target will always be $12.00, a 20% gain. The downward target will rise from $6.00 (a 25% loss) to $8.00 (a 20% loss) as the pattern matures.
Optional: Flagpole
Even though this is not a flag pattern, it may begin with a flagpole on rare occasions. This incisive, near-vertical drop in price kicks things off in a big way. It would be at least as tall as the triangle, if not far taller. It would have no real bearing on the pattern itself. But it may become a factor in the aftermath.
Internal Price Swings
As triangles develop, price oscillates between support and resistance. Not every swing will make it to one of the two main trend lines. But patterns with a lot of empty space are seen as less reliable. In this way, ranging price action adds validity. These shorter-term trends also open the door for swing trades. As price continues to coil into a more and more narrow range, though, such opportunities tend to dry up.
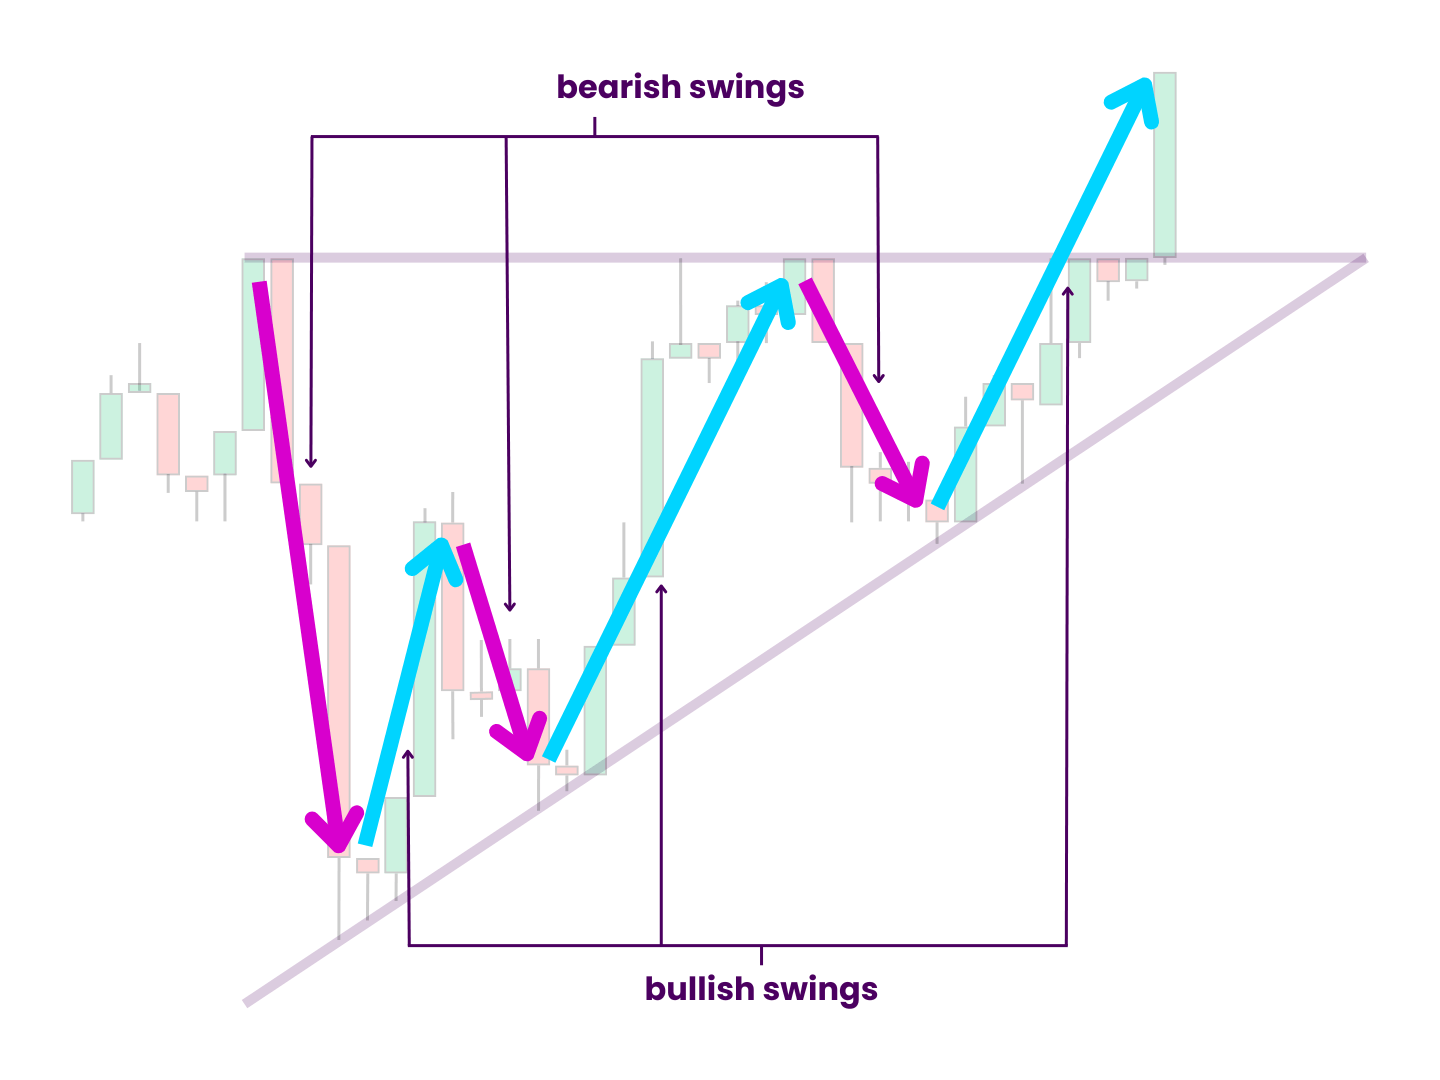
Criteria: Internal price swings should fill the triangle in an approximate sawtooth pattern.
Trend Line Tests
Each test of support or resistance is a bit of a battleground. Sure, these tests are important for pattern validity. However, each is a potential breaking point, with progressively higher stakes as the pattern matures. Scalp traders may celebrate the volatility spikes. But others look on with baited breath.
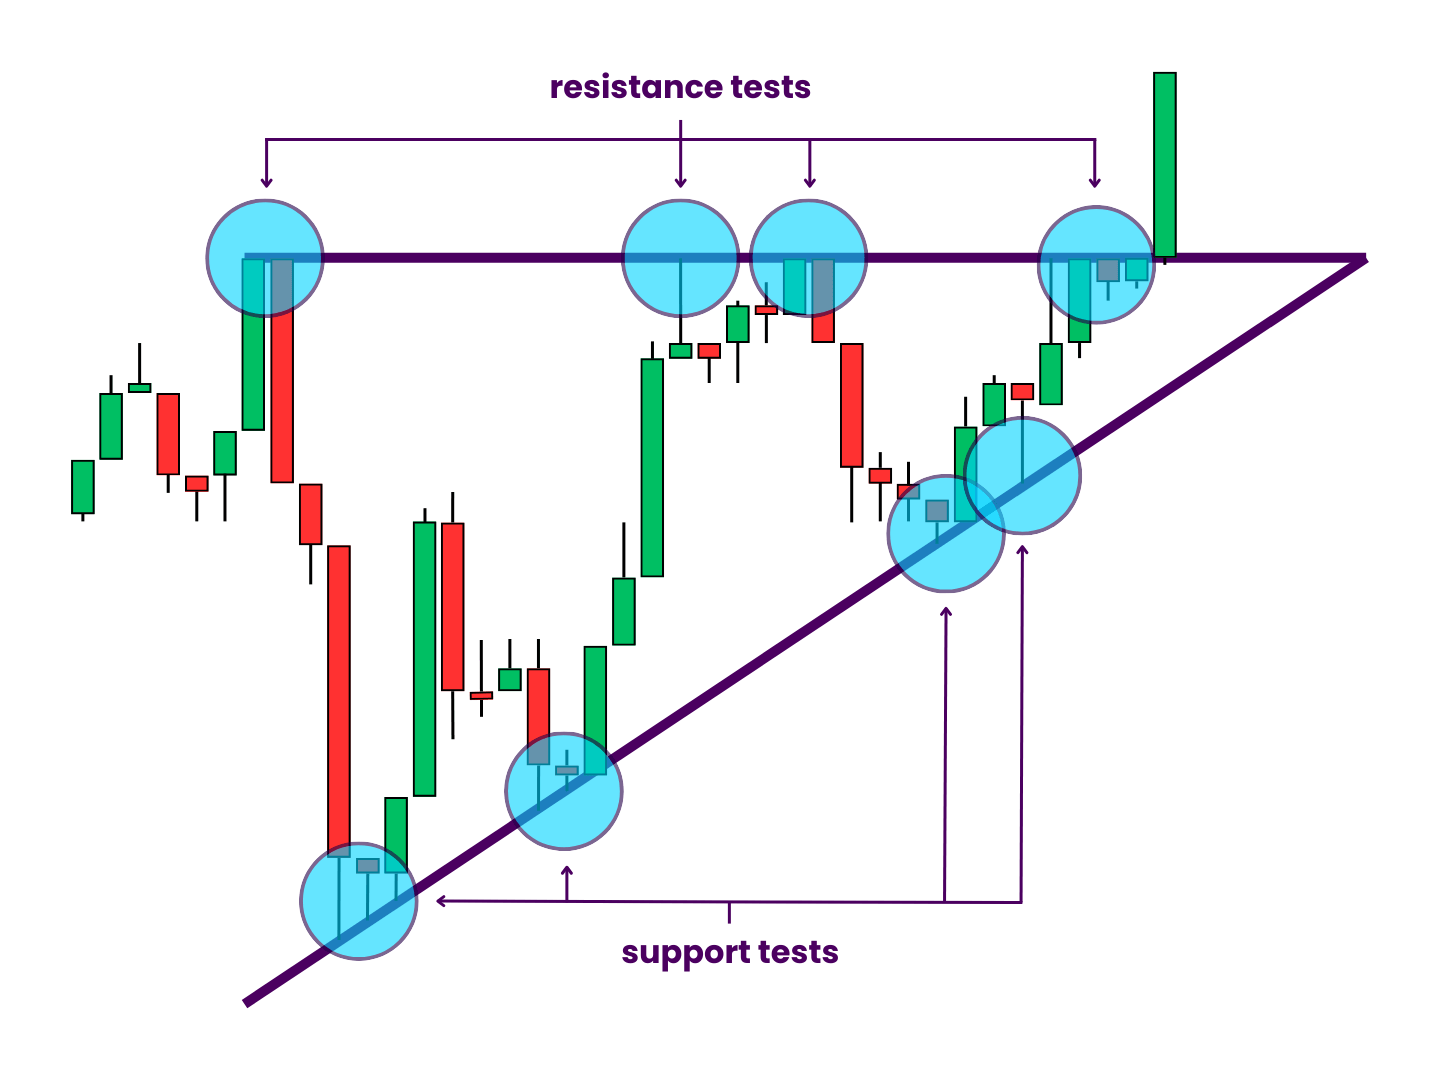
Criteria: The support and resistance lines must be tested at least five times in total. More successful tests are generally seen as an omen of higher reliability.
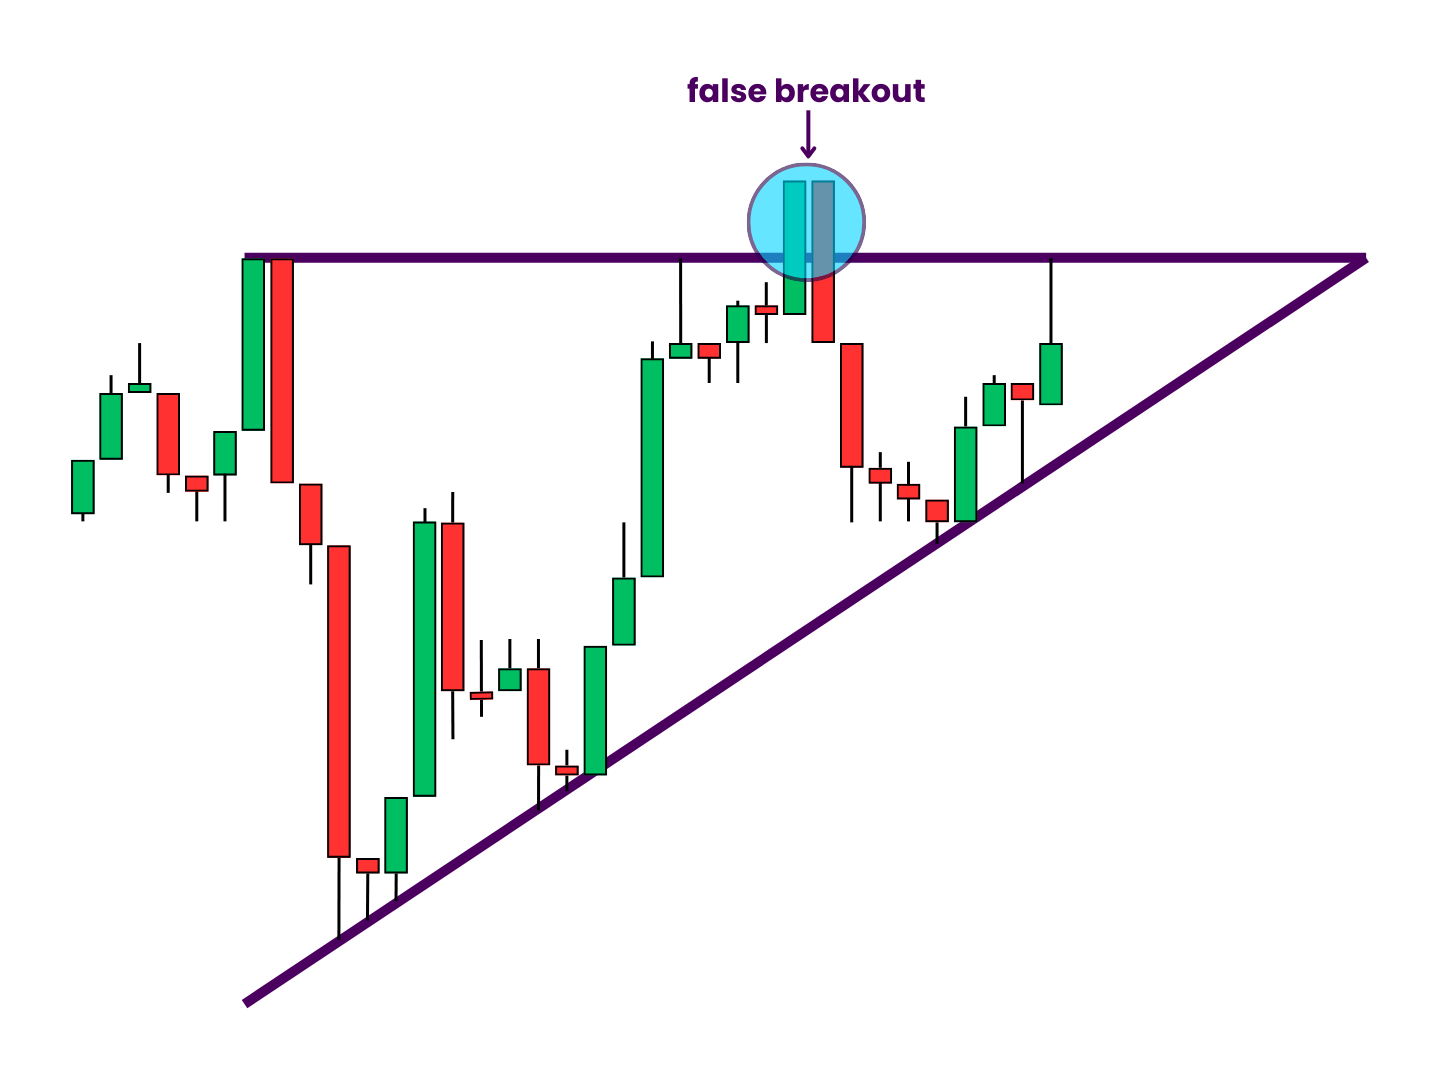
Fakeouts
The true breakout is often preceded by one or more false breakouts, or fakeouts. These fleeting moves burst through one of the trend lines then trade back inside them shortly thereafter. Fakeouts may shatter the structure and invalidate the pattern completely. Or, they may only require a bit of redrawing or zooming out. They could be a sign of an appetite for action at higher or lower prices. Or, they could be the byproduct of a stop hunt.
Breakout & Breakout Point
The breakout is the reason everyone comes to the party in the first place. It’s where the fun truly begins. If the price breaks up, we call the ascending triangle successful. If it breaks down, we call it a failure. From this point, it stays above or below the formation for good. All that’s left is to see how far it goes.
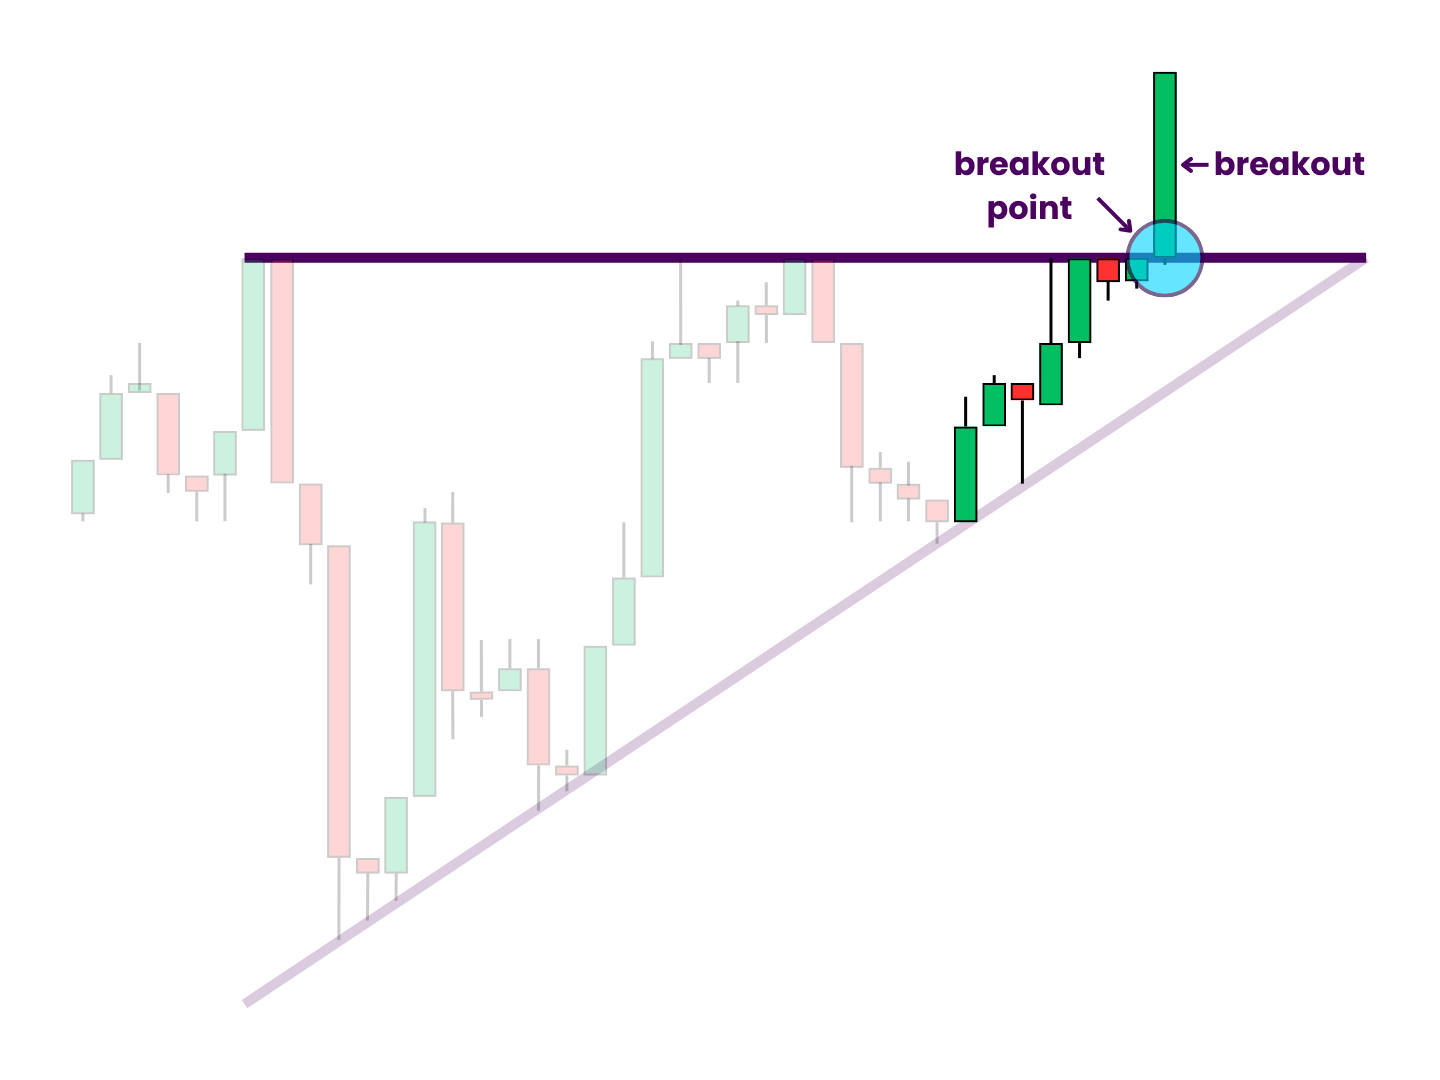
Criteria: The breakout must close outside the pattern and stay outside the pattern. At the very least, it cannot close below the original resistance line.
Pullback (& Retest)
Pullbacks after the breakout are the norm, but not an inevitability. They can be deep or shallow, immediate or delayed. Full retests of the breakout line are common, but not guaranteed. Most patterns perform better without them. This is true of both upside and downside breakouts.
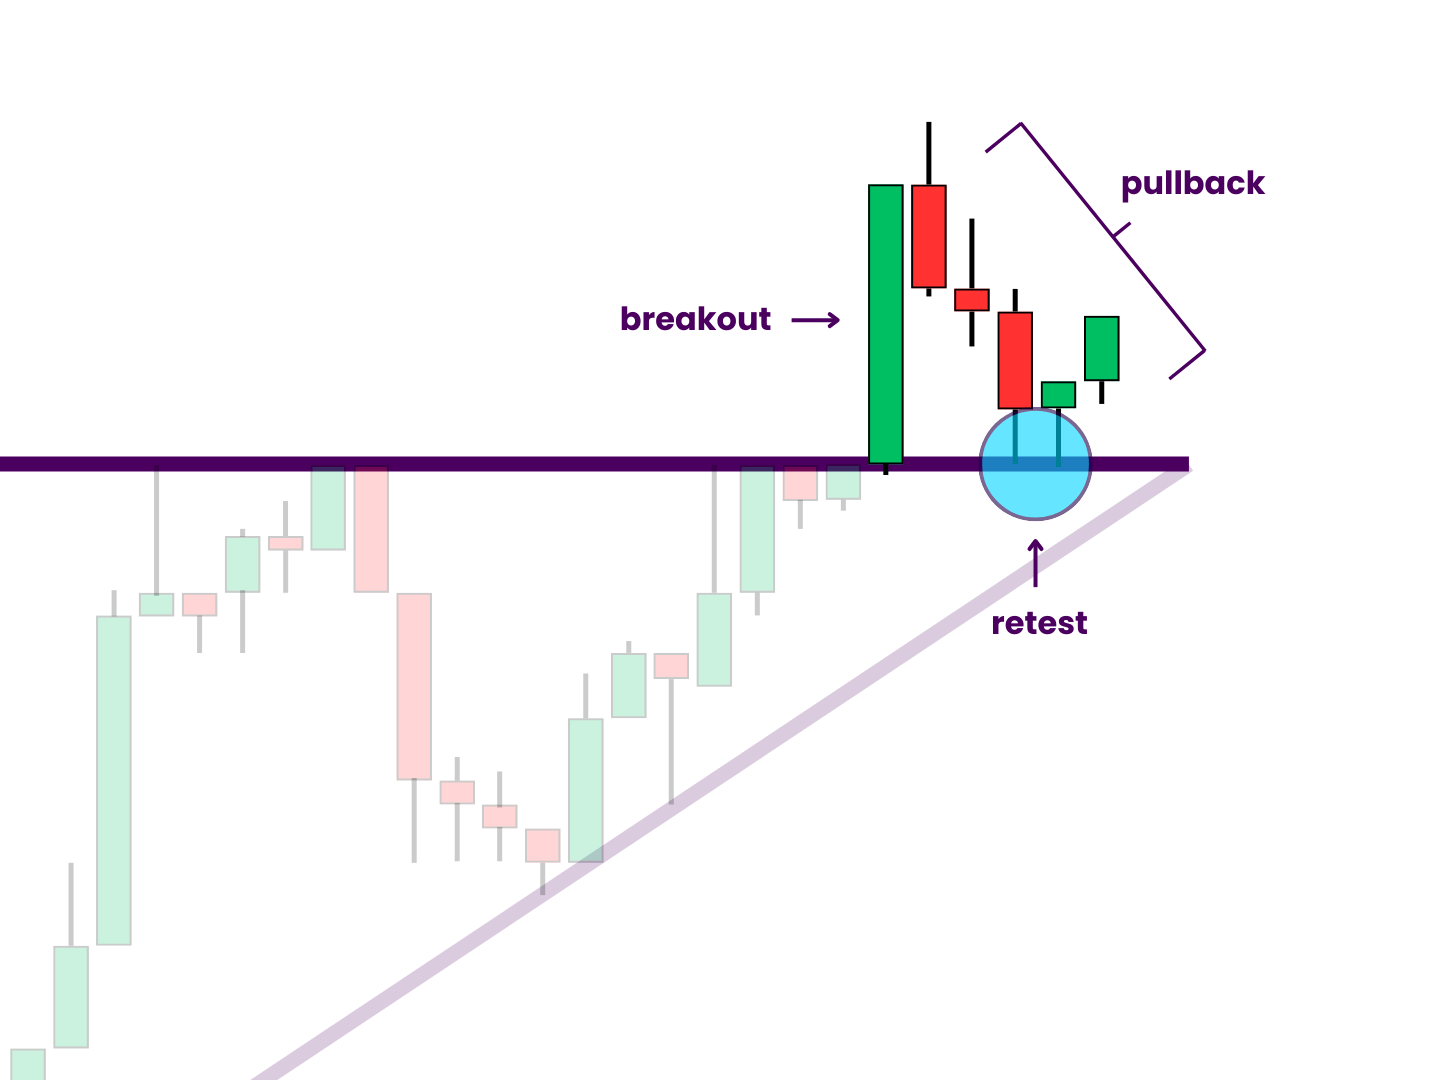
Criteria: The pullback must not close below the resistance-turned-support line. If it does, it invalidates the breakout.
Trading Volume
Volume is one of the most cited chart pattern validation and confirmation factors. Traders expect decreasing volume during consolidation and increasing volume during the breakout. Low volume on a breakout may be indicative of a fakeout.
Criteria: Trading volume should trend down at a rate that matches the length of the triangle. It should then break out of this trend at the same time the price does. Ideally, there would be a large volume spike followed by elevated volume until the target is met.
Where Ascending Triangles Fit in the Chart Narrative
The markets are often characterized as a battle between the bulls and the bears.
It’s like the charts have a story to tell.
Patterns are a natural progression from market cycles, trends, and price levels. They also build on the data from candlesticks and candlestick patterns (even though you can usually see them on a line chart).
However, chart patterns have an even larger impact on the chart narrative.
That’s partly because they tend to span longer periods of time and therefore carry more weight. But it is also due to their popularity. This is especially true of the most iconic patterns like the ascending triangle. Since they are so well-known, there are often many parties itching to join the fray.
This frequently foreshadows dramatic pieces of price action.
Ascending Triangle Market Psychology
The ascending triangle is a visualization of the psychology of the market.
It illustrates rising optimism from the bulls, stymied only by the stubbornness bears—which appears to be wearing thin.
Imagine this scenario:
There is a long-standing uptrend. The bears get a brief moment in the sun, scoring a dramatic pullback. Over the next few weeks, the bulls retake control and march the price back up to the breakdown level. Many take profit, and allow the price to drift back down. Before it reaches the prior low, buyers wrestle back the reins once again and go for another test of the horizontal resistance level. This cycle repeats for several weeks, with the bulls buying the price back up every time it falls.
Now, price rallies back toward the top of the pattern for what seems like the final showdown.
Some of the bears may think, “This time will be different.” But the majority are probably thinking, “Here comes more pain.”
An impartial spectator may predict the bulls’ vigor will break the bears’ resolve.
A gambler may bet on who they want to win.
A trader would find a way to profit no matter who wins.
You can picture this scenario anytime you see price ranging between a horizontal top and a rising bottom. It could apply to any tradeable asset. However, no two triangles will have exactly the same story. Nor will they play out in exactly the same way. But true traders consider what both sides are thinking.
The frequency and performance of ascending triangles varies across markets. So study their historical performance on your preferred asset(s) and time frames specifically.
How To Chart Ascending Triangle Patterns
From here, all you really need is basic chart markup skills.
TradingView has both a triangle tool and a triangle pattern tool if you need them. But they are extremely easy to draw with trend lines and/or extended trend lines. That’s what you’ll see most traders use. They are more than adequate to map out all the important levels and decision zones.
Then, analyze the ascending triangle pattern with your favorite trading indicators and tools.
You may need to adjust or redraw your lines several times. When you’re new, it can be a bit like trying to read tea leaves. One ascending triangle can lead into a larger one. Or, a “failed” ascending triangle can evolve into a symmetrical triangle or a convoluted cup and handle.
That’s why each pattern’s criteria is so important.
Like all technical analysis tools, chart patterns are just a framework for understanding price action.
You’ll need more in your arsenal to consistently make money with them.
How To Trade Ascending Triangle Patterns
The basic concept for trading ascending triangles is very easy to understand.
As with all triangle patterns, you can get in on a breakout trade on either side of the formation.
The conventional bullish trade is:
- Step 1: Take a long trade if/when the price closes above the horizontal resistance line.
- Step 2: Place your stop loss just below the horizontal.
- Step 3: Set your profit target by adding the triangle’s height to the horizontal resistance line.
The conventional bearish trade is:
- Step 1: Take a short trade if/when the price closes below the rising support line.
- Step 2: Place your stop loss just above the breakdown point.
- Step 3: Set your primary profit target by subtracting the triangle’s height from the rising support line at the breakdown point.
The clarity of these rules makes for a very tradeable pattern.
Plus, there are many things you can do to optimize its use.
Still, you probably shouldn’t aspire to be a “pattern trader.” Learning to use patterns is a great place to start. But you’ll eventually want (or need) to move on to more sophisticated strategies. These may use patterns, but not as the centerpiece. Luckily, traditional chart patterns are easy to integrate into many different trading styles.
A reliable trading strategy requires a dependable edge and calculated risk management. Learn trading math and order types well. Add some options and/or automation if you really want to cook.
However you choose to do your ascending triangle trading, keep your rules strict.
Signals mean nothing without proper trade execution.
Step 1: Where & How To Enter Ascending Triangle Trades
You have multiple options to play the breakout straight.
You could watch the pattern and place a market order on the candle after the breakout. Or, you could forgo the candle watching by implementing price and/or volume alerts. You could even place a stop limit to buy the breakout automatically (though that does have its own risks).
Yet there is more you can do to get the best entry possible.
Early Entries
The most logical way to get a higher percentage profit is to buy tests of the lower trend line before the breakout. Even if you enter on one of the final tests of the lower support line, it will increase your potential gains. It could also enable a break-even stop loss below the horizontal trend line once the pattern breaks upward. Just keep in mind, it could open you up to more risk.
Considered Confirmation
Where you assign confirmation can make a big difference to your risk/reward ratio. Volume, higher-term candle closes, candlestick patterns, and indicator signals are all legitimate options. Some traders may even wait to buy the retest of the resistance-turned-support horizontal. Ideally, you’d back up your own choice with historical analysis.
Playing the “Fail”
Ascending triangles that break down are almost as easy to trade as successful ones. Assign the measured move to the bottom of the breakdown, and you have your bearish price target. If price hits this target, it will result in a lower swing low, all but clinching a downtrend. In this way, failed ascending triangles have nearly as much long-term potential as successful ones.
Step 2: Where & How To Exit Ascending Triangle Trades
You already know the price targets on both sides.
In fact, everyone knows them. What’s more, ascending triangles are among the easiest-to-program patterns. This and their general notoriety attract increased trading activity. In turn, this can contribute to both underperformance and overperformance. When everyone is looking at the same thing, funny things can happen.
That’s just one reason why it’s crucial to know your gameplan going into every trade.
Frontrunning
Overhead resistance may stall price, or prevent it from reaching the target altogether. Make note of prior levels, important moving averages, and other potential obstacles. Conservative bulls may take profits here. Aggressive bears may look for shorts. Both of these exert pressure against the breakout. In response, you could consider locking in some or all your gains here too. Identify these levels and establish your contingency plans in advance.
Staying Exposed
If you’re more patient, you can opt to stay in the trade, giving price more time to reach the target. After all, if the target on either side gets met, the greater trend will likely follow. By using a trailing stop loss, you may be able to stay exposed in a risk-free trade. This is why ascending triangles often lay the foundations of longer-term positions.
Breaking It Up
You could also do all of the above by deploying different chunks of capital in different ways. For example, you might sell a portion at a primary profit target, then set a break-even stop loss and let the rest ride. This is common for Bitcoin traders, who often trade to accumulate Bitcoin in lieu of fiat currency due to their deep belief in the asset’s long-term future. Beware though. This hybrid trading/investing approach can make it hard to keep your P&L in perspective.
Okay, now your exits are optimized.
Let’s talk about where most people screw up.
Step 3: Where & How To Stop-Loss Ascending Triangle Trades
You also have options when it comes to stop-losses.
The initial stop loss is typically placed in one of three locations. First, you can place it on the other side of the newly broken trend line. Second, you can place it on the other side of the last swing high or low. Third, you can place it on the other side of the pattern. (The last two may or may not be the same level.)
It partly comes down to your risk tolerance. Tighter stops lower potential losses. But they can also lead to premature exits.
Whatever you do, just don’t freewheel it.
Get in the habit.
Set. Stops. (Even if they are loose.)
Moreover, how you use them should match your overall strategy.
Trailing Stop Loss
Some traders prefer trailing stop losses. This more passive technique allows you to lock in unrealized gains without exiting. Instead of cashing out, shadow the trend with your stop loss. Lesser pullbacks, moving averages, Fibonacci extension levels, and other minor levels are all options. If you’re well in the money or trading long-term, you could even go with a fixed percentage. It is such a common practice that some trading platforms and tools allow you to automate it. Sure, it can make you susceptible to stop hunts. But that’s better than losing money.
Break Even Stop Loss
Break-even stop losses are meant to do one thing. They prevent you from taking an L from a winning position, which is one of the worst feelings in trading. As soon as it is appropriate, move your stop loss up to a level that ensures you can’t lose money. You’ll be able to do it earlier if you bought the opposite trend line. Otherwise, you may have to wait until some sort of post-breakout support or resistance. This strategy is a great way for newer traders to keep confidence high. It can also protect you from false breakouts.
Other Chart Pattern Types
The ascending triangle pattern operates in the same way as many others.
It has very similar rules to other triangle patterns. As a consolidation pattern and bullish chart pattern, it is also an accumulation pattern. Additionally, it shares traits with most other chart continuation patterns.
It is a good idea to study more of these patterns and their relationships.
The vast majority of them are worth learning about.
- Adam and Eve Patterns
- Ascending Triangle Patterns
- Bear Flag Patterns
- Cup and Handle Patterns
- Descending Triangle Patterns
- Descending Wedge Patterns
- Double Bottom Patterns
- Double Top Patterns
- Head and Shoulders Patterns
- Rising Wedge
- V Bottom Patterns
- W Pattern Patterns
At the very least, you should do a deep dive on the most popular and common ones. Then, skim the rest of the list if you must. You don’t have to commit every single one to memory.
However, learning about different chart patterns has big advantages. It will help you find more trading opportunities. Perhaps more importantly, it will expose you to many proven trading ideas. More importantly still, it will teach you a lot about price action, market psychology, and more.
In the end, how patterns help elucidate the story in the charts is even more useful than the signals they provide.
True traders always consider contingencies for whatever the market brings anyway.
Takeaways
To review:
The ascending triangle is a bullish accumulation pattern.
- It is characterized by rising support and horizontal resistance.
- It gives a bullish bias and acts as a continuation signal most often.
- The standard trade is a breakout trade above the resistance line or below the support line.
- Ascending triangle patterns are simple, easy to recognize, well-known, and appear often.
- They are easy to incorporate into many types of trading strategies and perform well.
- They are especially popular among new traders, breakout traders, and pattern traders.
Like all chart patterns, ascending triangles don’t guarantee anything. However, they do hint at upcoming possibilities. They also come with a proven trading framework. What’s more, you can study more patterns to find even more opportunities.
Patterns may not be a silver bullet, but they are a useful weapon in your trading arsenal.
Have questions or more information to add? Contribute to the conversation in the comments below! Or, if you know someone who could benefit from this post, share it with them. You can also check out our Chart Patterns Guide to improve your chart analysis skills.

0 Comments