Rising wedge chart patterns are common and widely recognized, but nuanced.
Chart patterns are one of the most popular forms of technical analysis. That’s unsurprising, considering how easy they are to understand and trade. Not to mention, they work with virtually all tradable assets.
In this Rising Wedge Pattern Trading Guide, we’ll dive DEEP on:
- How They Work
- What They Mean
- Components & Criteria
- Where They Fit
- Their Psychology
- How To Chart Them
- How to Trade Them
- Similar Chart Patterns
First, let’s start with the basics.
What Is a Rising Wedge Chart Pattern?
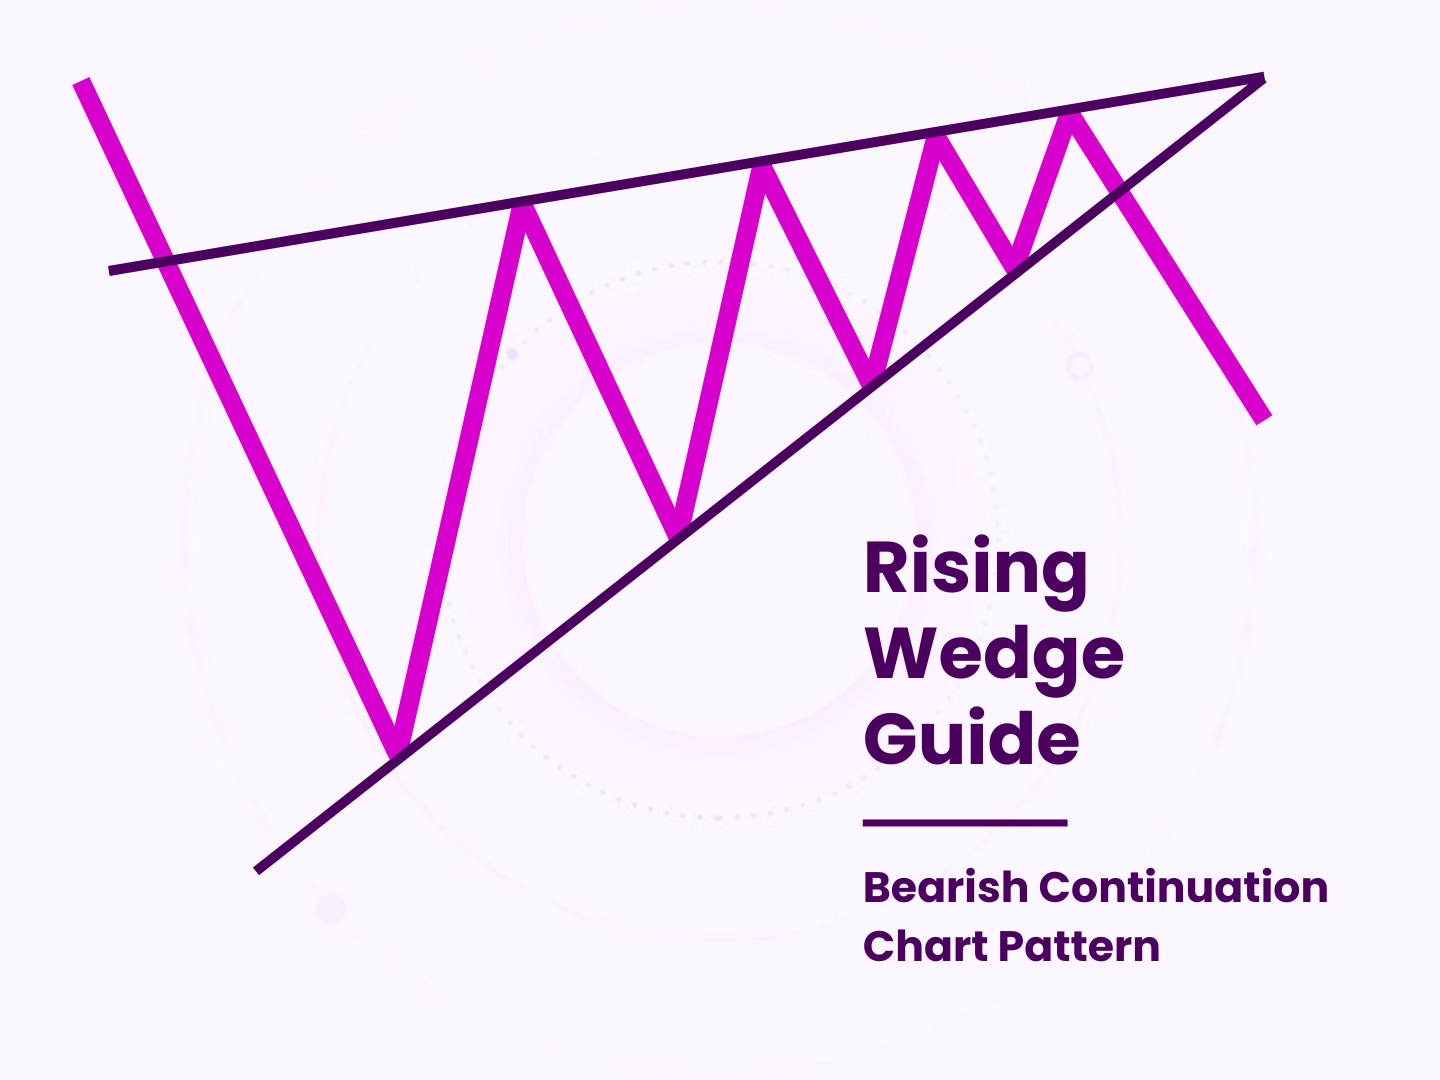
A rising wedge (or “ascending wedge” or “bearish wedge”) is a bearish chart pattern. It consists of a significant sell-off followed by a bounce that is enclosed by two converging, rising trend lines. Price falls, then consolidates between a series of narrowing higher highs and higher lows. It is most commonly used as a continuation signal.
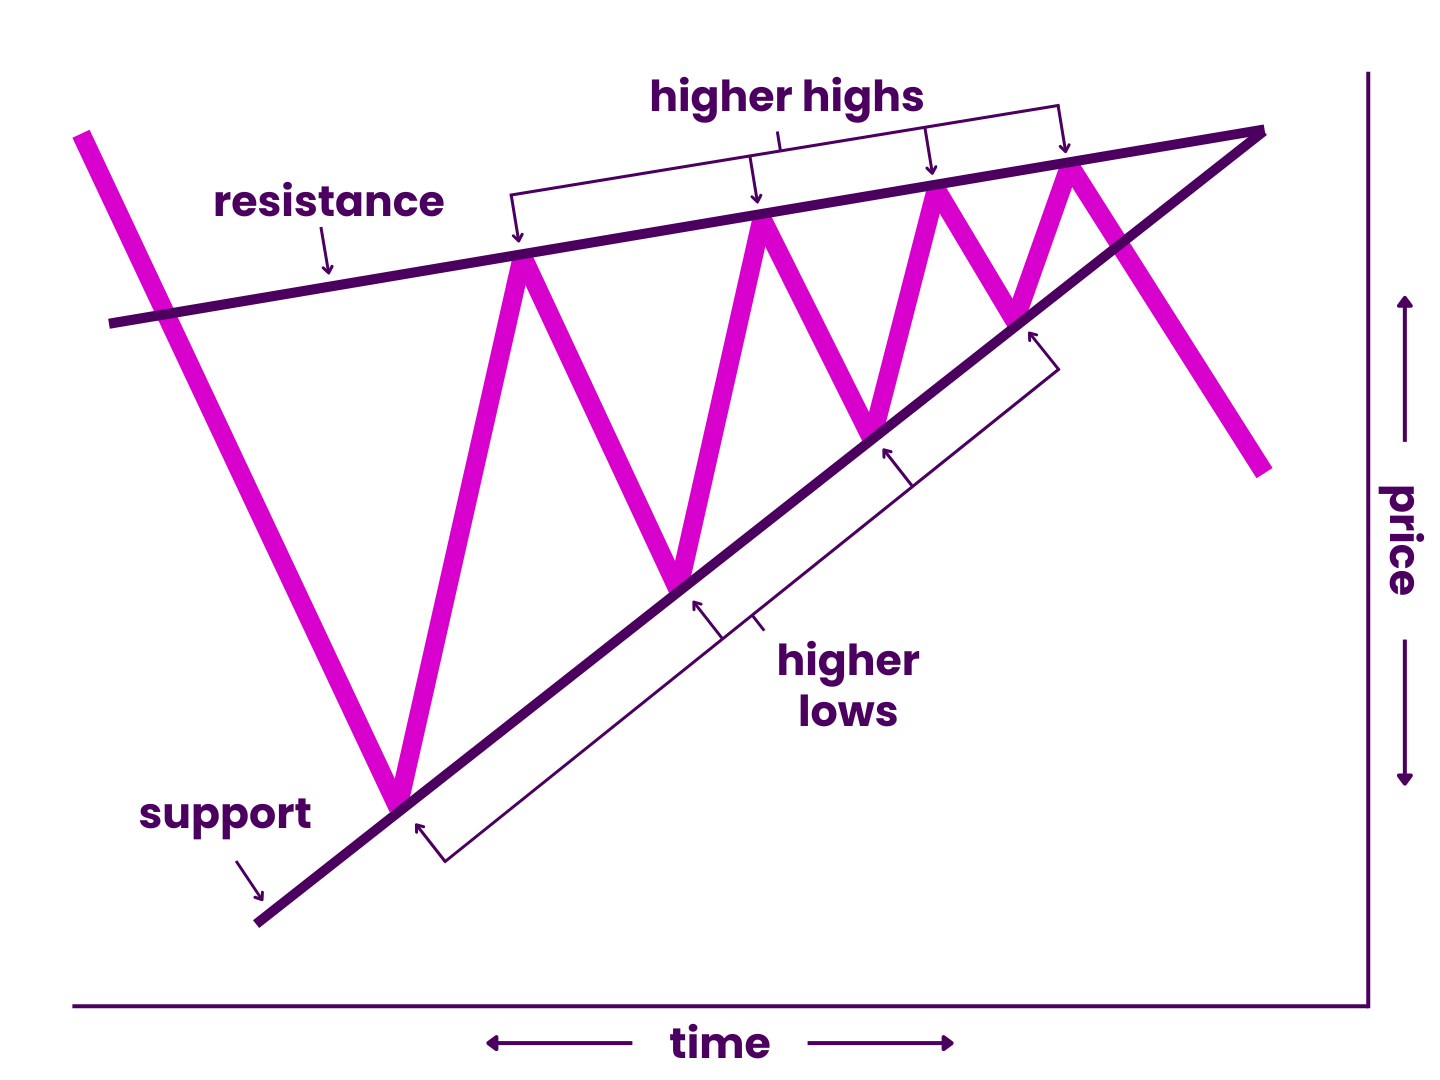
Naturally, the rising wedge is similar to other wedge patterns (and is the opposite of the falling wedge). It also has overlap with the bearish pennant, bear flag, and ascending triangle.
As with all chart patterns, they are more a suggestion than promise. You should never look at them as guarantees!
However, they can still help you make money if you know how they work.
How Rising Wedges Work
Bearish wedges arise due to a common scenario.
They begin when price falls to a dramatic new swing low.
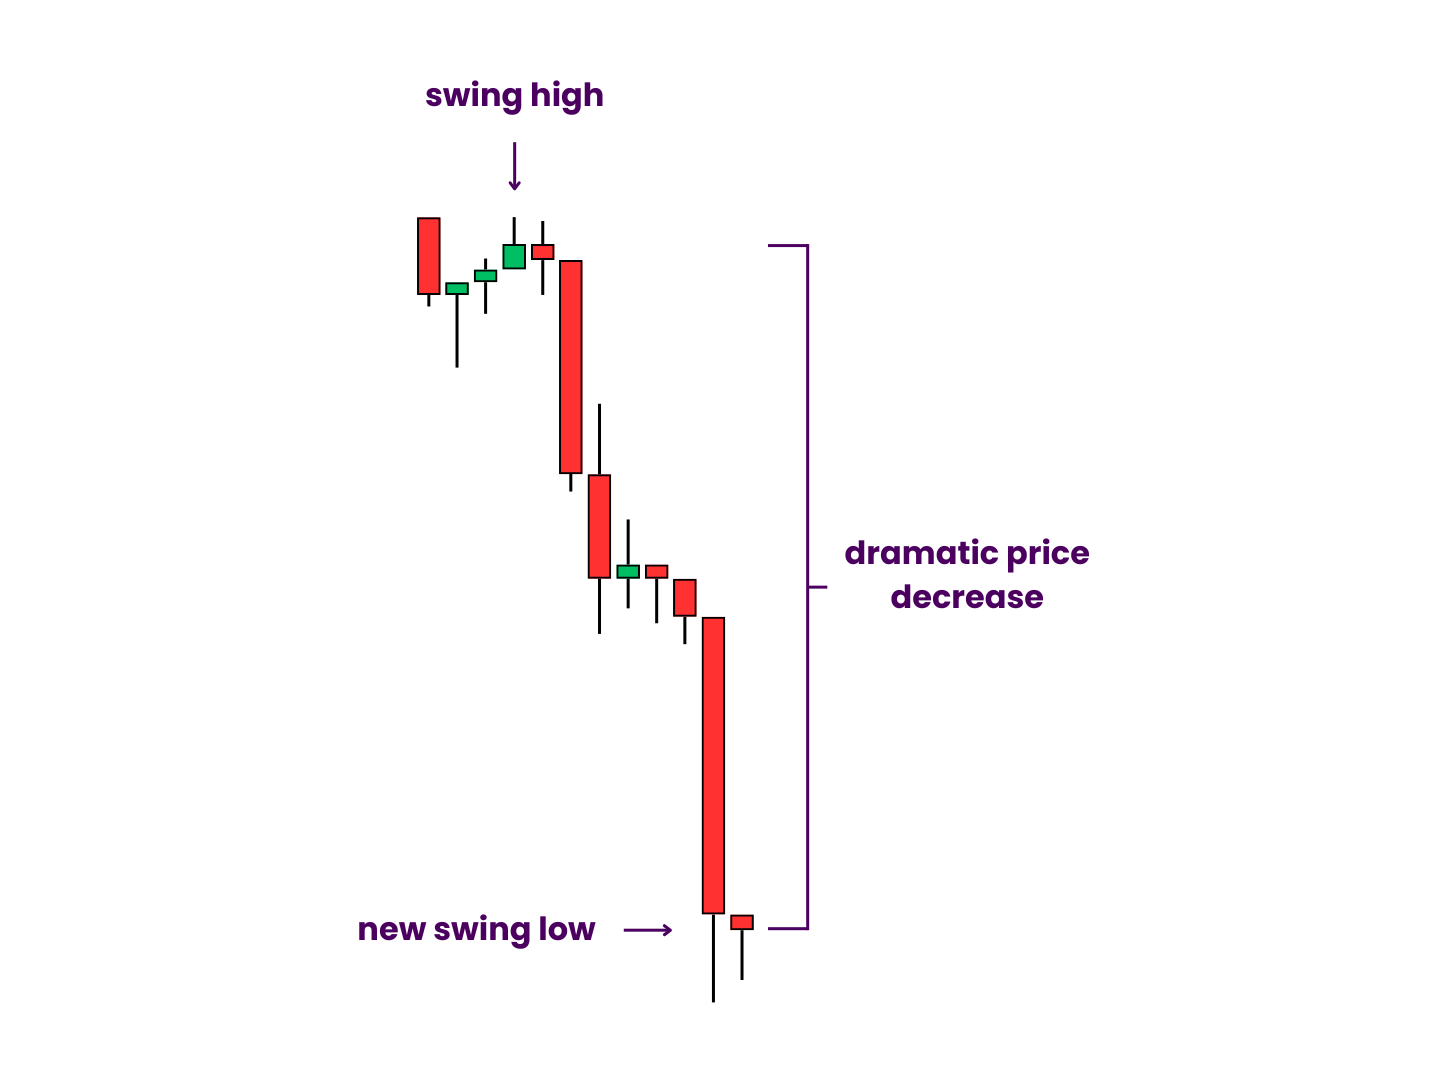
It rebounds shortly thereafter, and eventually rises to form a much lower lower high. It falls again, but this time, not quite as low as the previous time. The next time it rises, it sets a modestly higher swing high than the one before it.
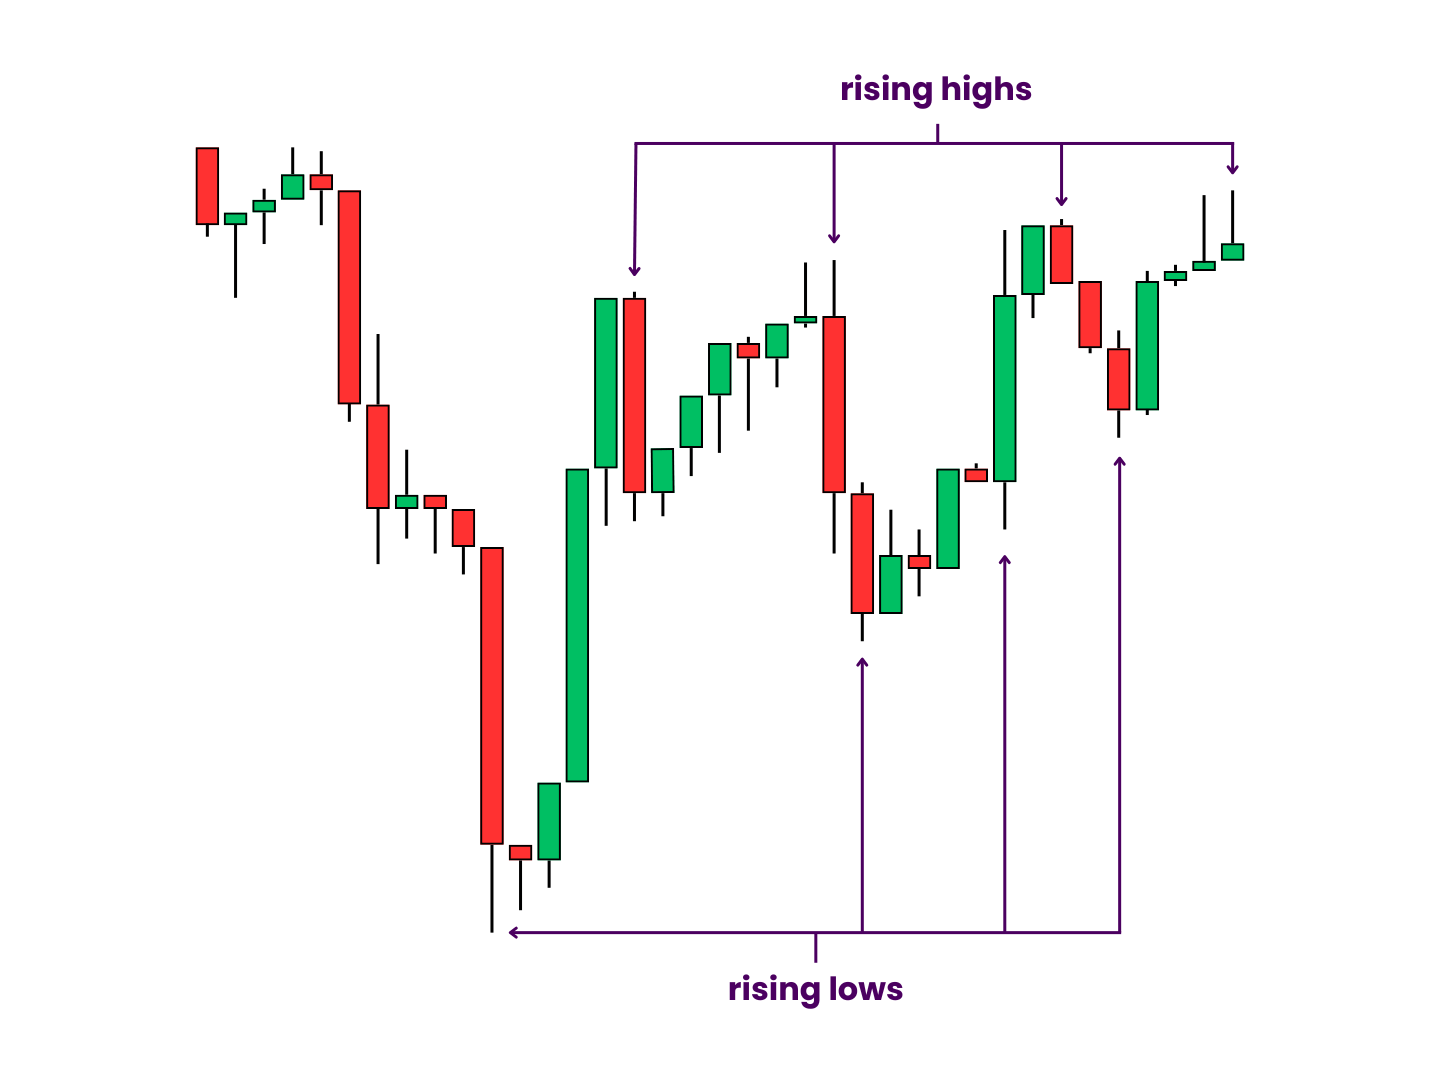
This happens repeatedly, in such a way that you can draw an ascending resistance line along the peaks and a steeper ascending support line along the valleys. Together, these outline the wedge. If the initial drop is large enough, it could be classified as a “flagpole” (though this is technically not a flag formation).
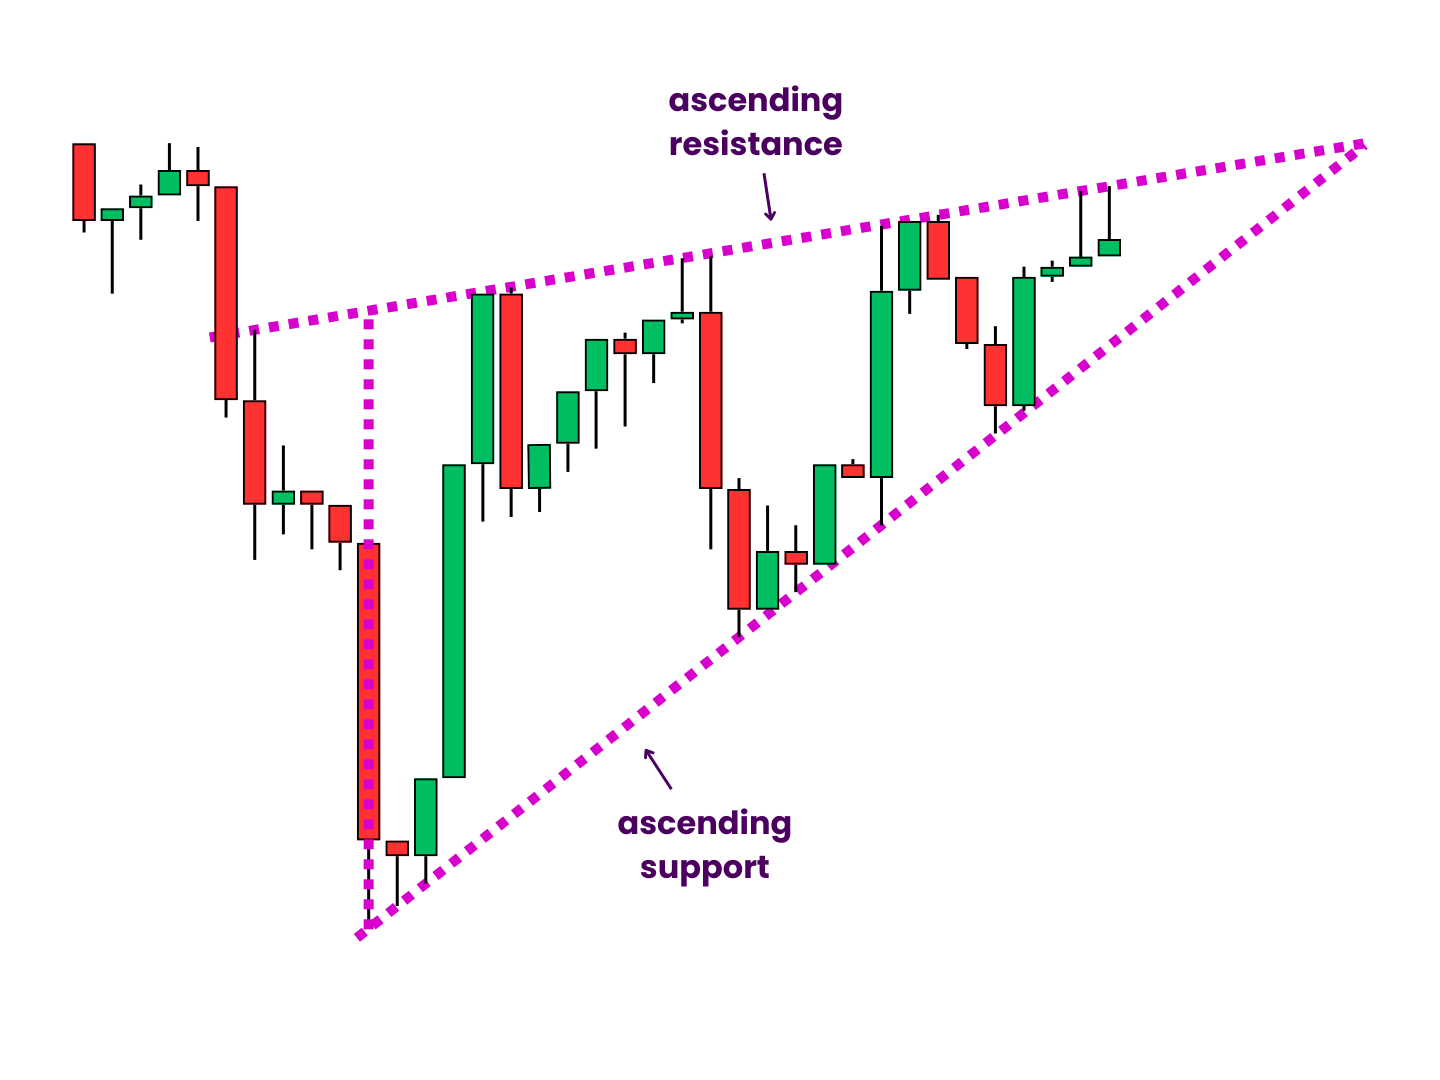
The rising wedge can also begin with a swing high instead of a swing low. In this case, the resistance line begins to develop before the support line.
Any candle close outside the pattern sets up a breakout trade in that direction. Bearish ones are seen as the main trading opportunity.
You can trade ascending wedges in stocks, forex, cryptocurrency, and most other markets. They appear across a variety of time frames. And they are very easy to see on the chart. No wonder beginner traders are so attracted to them.
This begs the question, then, what do they actually mean?
What Bearish Wedge Signals Mean
Bearish wedges represent a period of distribution.
In other words, some sellers are taking profits while others enter the market. The short-term uptrend provides a bit of relief for the bulls. Meanwhile, the bears are able to lock in high risk/reward positions. As the lows continue to catch up with the highs, the moment of truth approaches.
If the bears are able to generate enough selling pressure, they can shatter the bulls’ hope and continue the greater downtrend.
As the rising wedge pattern continues, volatility contracts and price consolidates. But that won’t last forever. Eventually, all that pent-up energy will have to be released.
Bearish wedges form during downtrends most often. When they do, they tend to signal continuation. They form less frequently during uptrends, but may signal reversal when they do (and perhaps even form longer-term tops) when they do.
They are a classic bearish chart pattern, after all.
In this way, successful rising wedge patterns imply a bearish bias but do not seal a bearish outcome. They show demand losing momentum against supply within an ever-tightening range. More often than not, they play out as distribution patterns, with the bears able to drive price lower.
Before you can identify rising wedges, however, you need to understand their makeup.
So let’s take a look at how they are made.
Rising Wedge Pattern Components & Criteria
Rising wedges have several parts.
Some remain static (or at least should remain static) throughout the pattern. Others develop as price changes over time.
Most components have specific criteria. Some of these are seen as guidelines. However, several of them are absolutely mandatory. If these conditions are not met, then the rising wedge is invalid. It loses all supposed predictive power. The price targets should be disregarded. The trend lines are then the only things that may still hold some weight.
Therefore, it is crucial you make sure all the pieces are in the proper place.
Resistance Line
The upper trend line acts as an increasing price limit. Its positive slope allows for successive higher highs. Still, the bulls will wish it was steep enough to outpace the rising lows. Don’t immediately erase it after pattern resolution either. It could continue to play a role as resistance down the road (or support if price breaks to the upside).
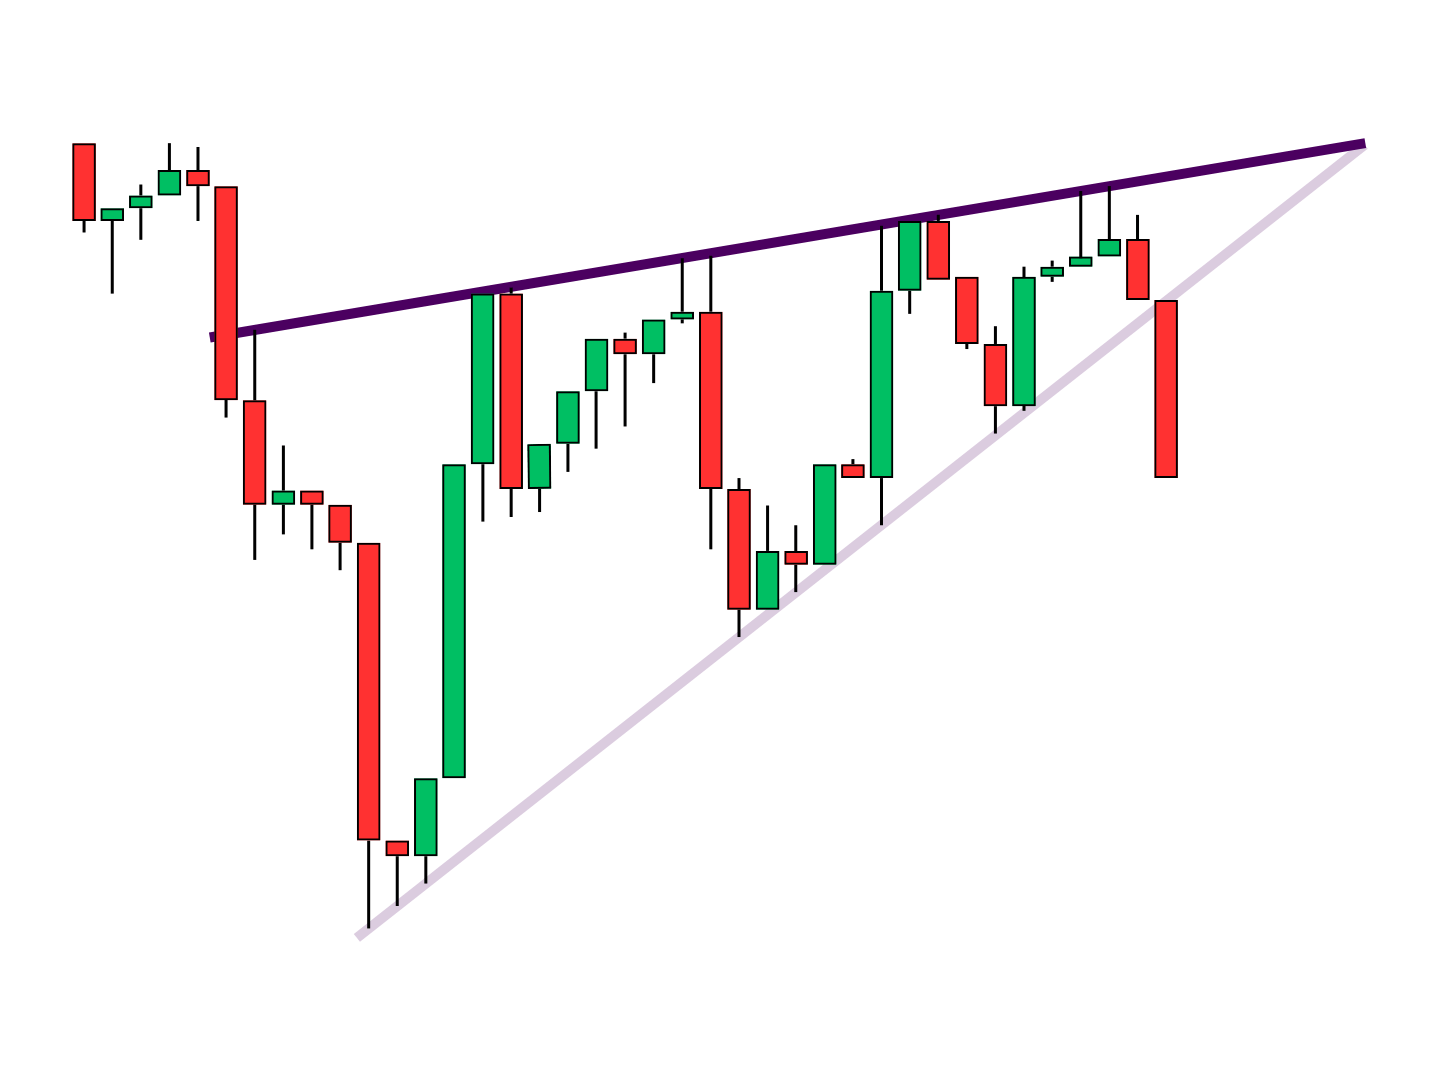
Criteria: The resistance line must have a positive slope and should connect at least three swing highs. The positive slope is non-negotiable but some traders may be willing to trust the line after only two touches.
Support Line
The lower trend line pushes price higher. Steeper than the resistance line, its slope puts pressure on buyers to make ever greater inroads. The difference in its rate of change and that of the upper trend line sets the pattern’s ultimate time limit. Again, don’t immediately erase it after a breakout as it may continue to hold weight later on.
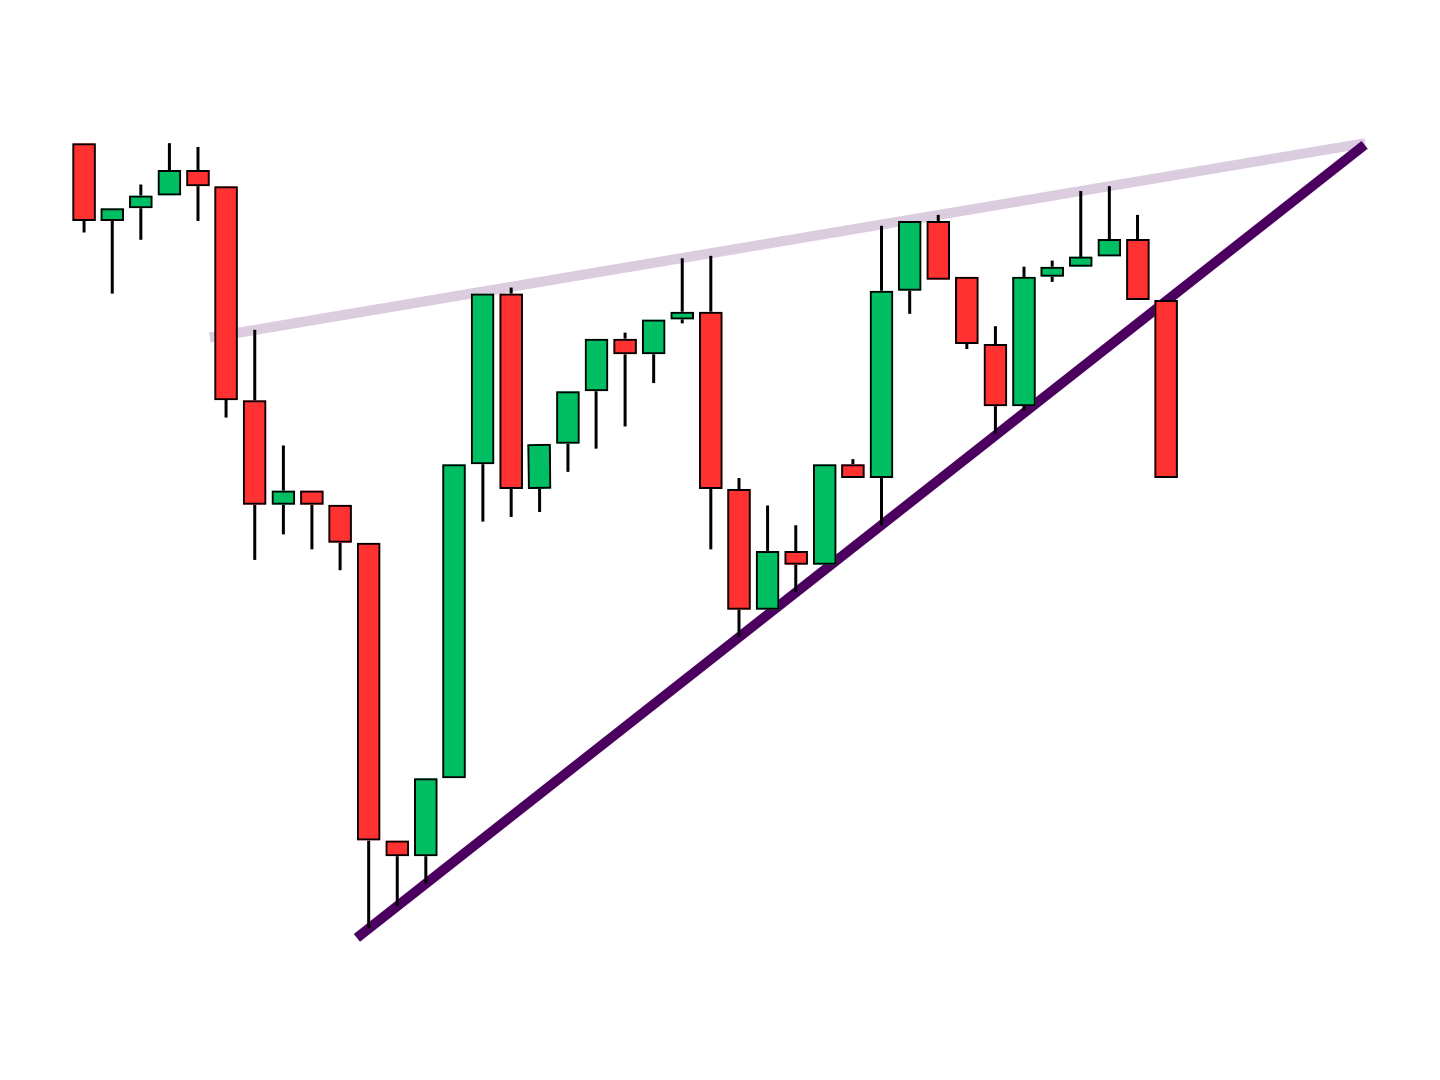
Criteria: The support line must have a positive slope and connect at least two swing lows. Ideally, you’d prefer to see a third touch (especially if the resistance line only has two).
(Projected) Apex
The intersection of the trend lines is the “end” of the pattern. However, 99.99% of wedges will see a breakdown or failure before price ever reaches this point. Many of them see a resolution when they are 60–70% “full.” Conventional wisdom says that breakouts grow more violent as wedges grow more full (though this does not necessarily ensure a more aggressive price target).
Price Target
Unlike most chart patterns, the rising wedge does not have a standard measure move rule. The most often referenced target is simply the pattern’s lowest swing low. However, this only applies to downward breakouts. Alternative, you might add or subtract the pattern’s height at its thickest from the breakout point. Or, you could replace the pattern’s height with the difference between its highest and lowest points. If a flagpole exists, its height could act as an extended target instead.
Optional: Flagpole
Though this pattern is not a flag, it often begins with a flagpole nonetheless. This is a steep, near-vertical drop that kicks things off. It should be a dramatic fall, similar to the first side of a v bottom pattern. Its length sets the overall tone of the pattern. Flagpoles do not impact the pattern directly but may play a role in the post-resolution aftermath.
Criteria: If present, the flagpole should be a large, near-vertical price decrease that spans only a handful of candles. Unlike actual flag patterns, there is no official 50% flagpole rule but it may be wise to keep the concept in mind.
Internal Price Swings
As wedges develop, price oscillates between support and resistance. Not every swing will make it to one of the two main trend lines. But patterns with a lot of empty space are seen as less reliable. In this way, ranging price action adds validity. These shorter-term trends also open the door for swing trades. As price continues to coil into a more and more narrow range, though, such opportunities tend to dry up.
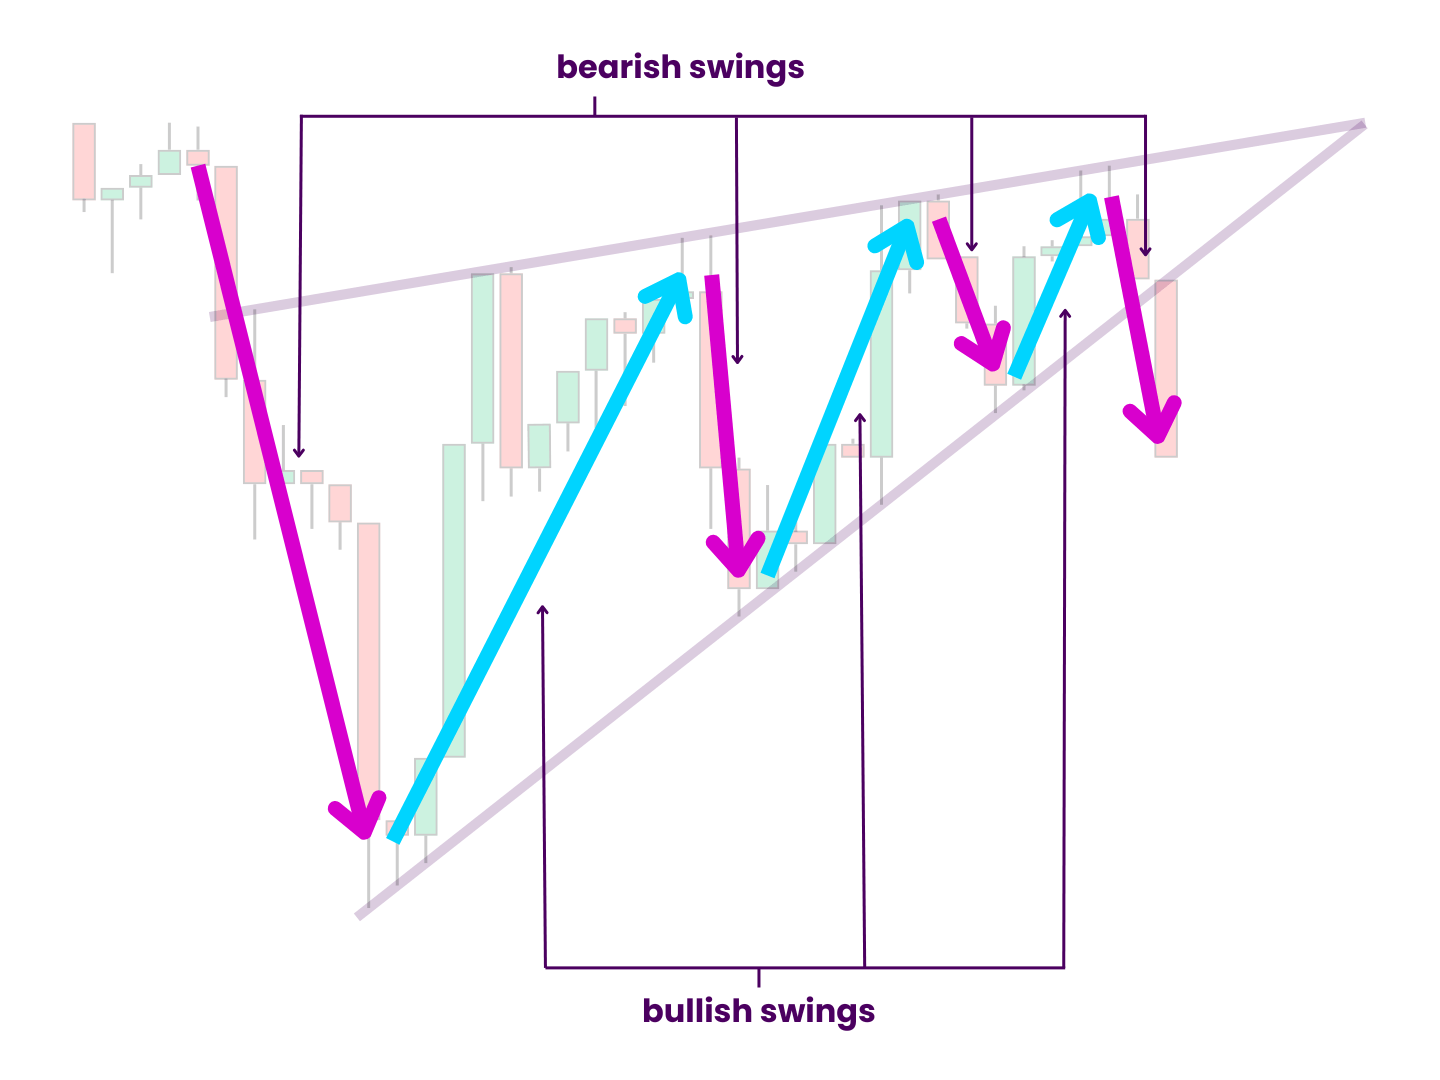
Criteria: Internal price swings should fill the triangle in an approximate sawtooth pattern.
Trend Line Tests
Each test of support or resistance is a bit of a battleground. Sure, these tests are important for pattern validity. However, each is a potential breaking point, with progressively higher stakes as the pattern matures. Scalp traders may celebrate the volatility spikes. But others look on with baited breath.
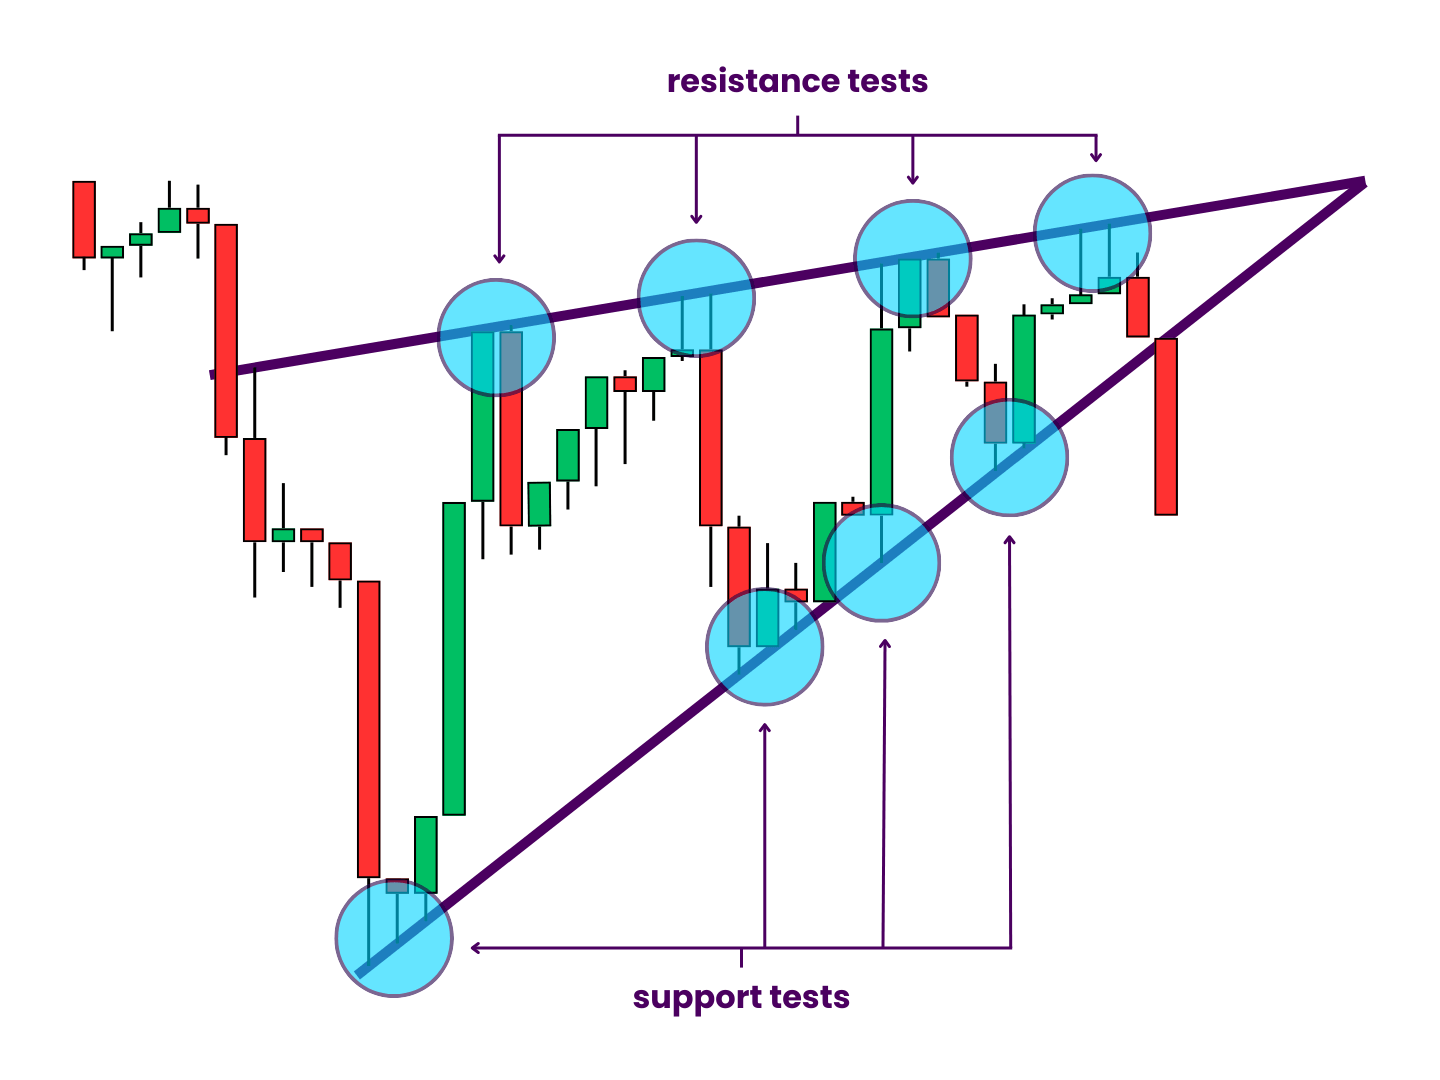
Criteria: The support and resistance lines must be tested at least five times in total. More successful tests are generally seen as an omen of higher reliability.
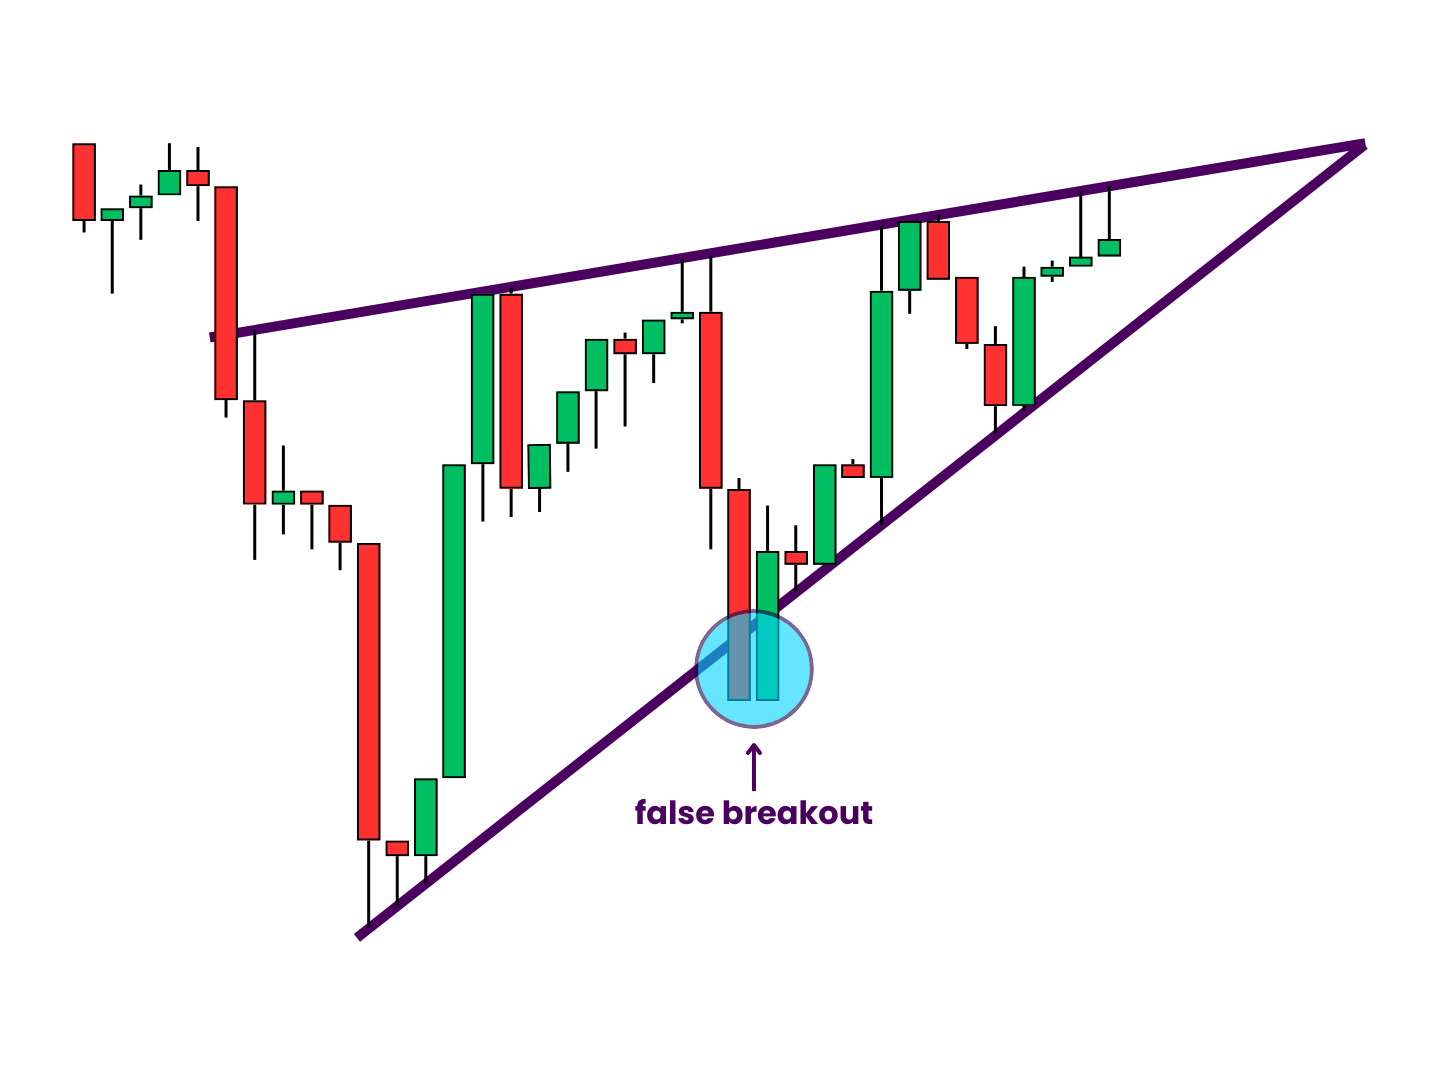
Fakeouts
The true breakout is often preceded by one or more false breakouts, or fakeouts. These fleeting moves burst through one of the trend lines then trade back inside them shortly thereafter. Fakeouts may shatter the structure and invalidate the pattern completely. Or, they may only require a bit of redrawing or zooming out. They could be a sign of an appetite for action at higher or lower prices. Or, they could be the byproduct of a stop hunt.
Breakout & Breakout Point
The breakout is the reason everyone comes to the party in the first place. It’s where the fun truly begins. If the price breaks down, we call the bearish wedge successful. If it breaks up, we call it a failure. From this point, it stays above or below the formation for good. All that’s left is to see how far it goes.
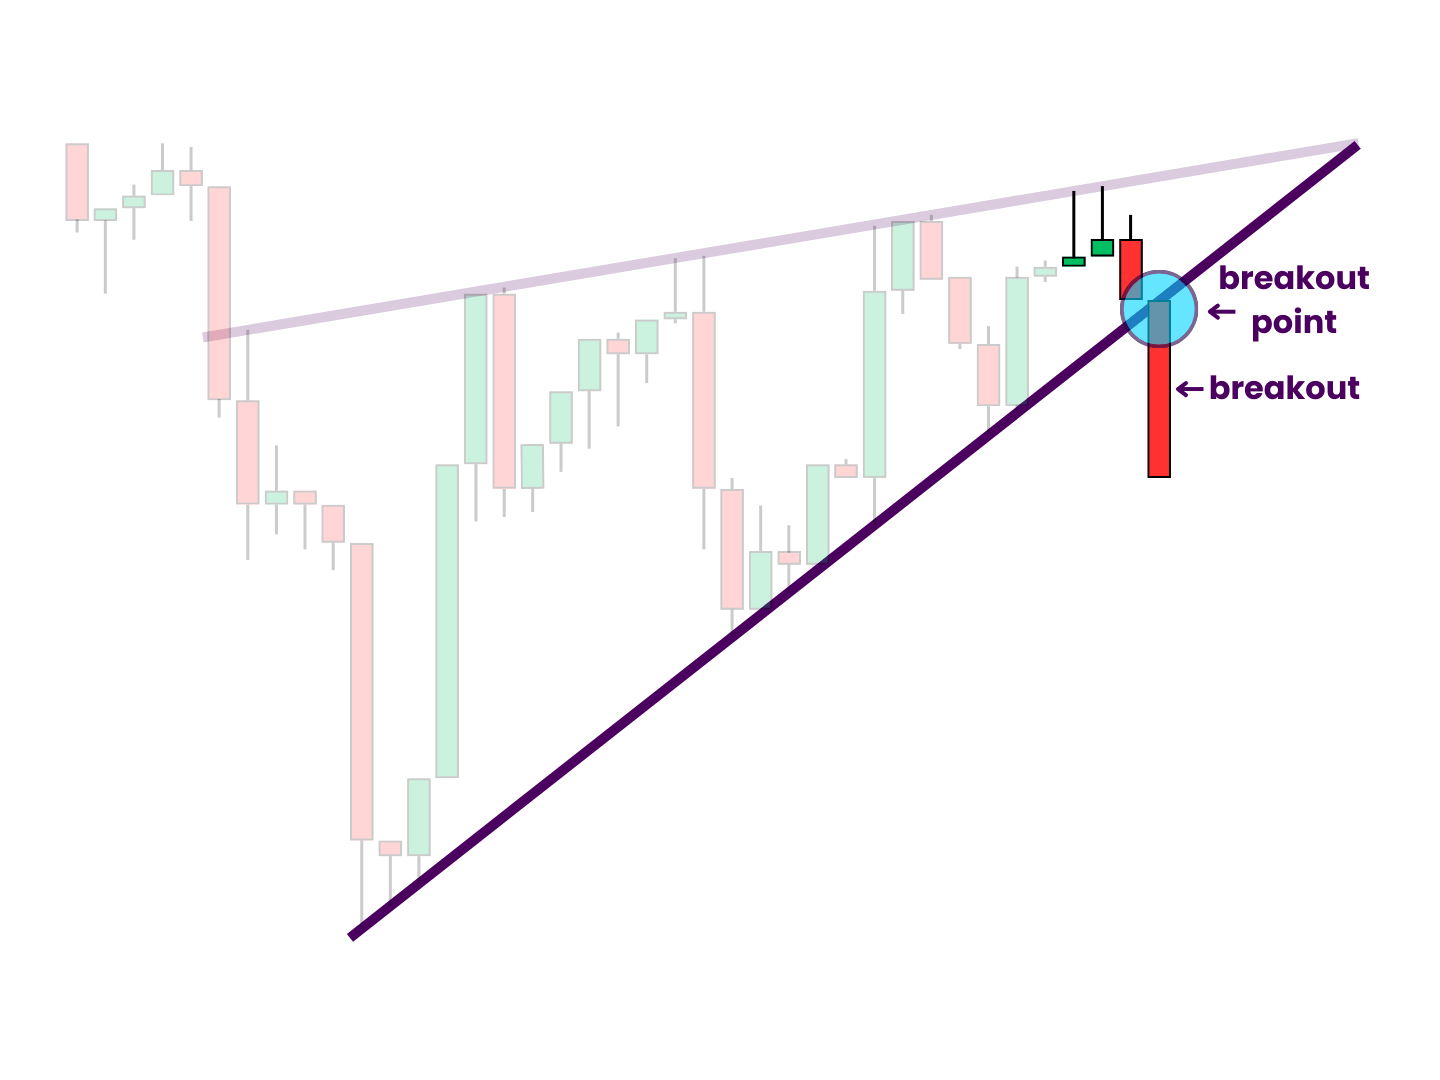
Criteria: The breakout must close outside the pattern and stay outside the pattern. At the very least, it cannot close above the original support line.
Pullback (& Retest)
Pullbacks after the breakout are the norm, but not an inevitability. They can be deep or shallow, immediate or delayed. Full retests of the breakout line are common, but not guaranteed. Most patterns perform better without them. This is true of both upside and downside breakouts.
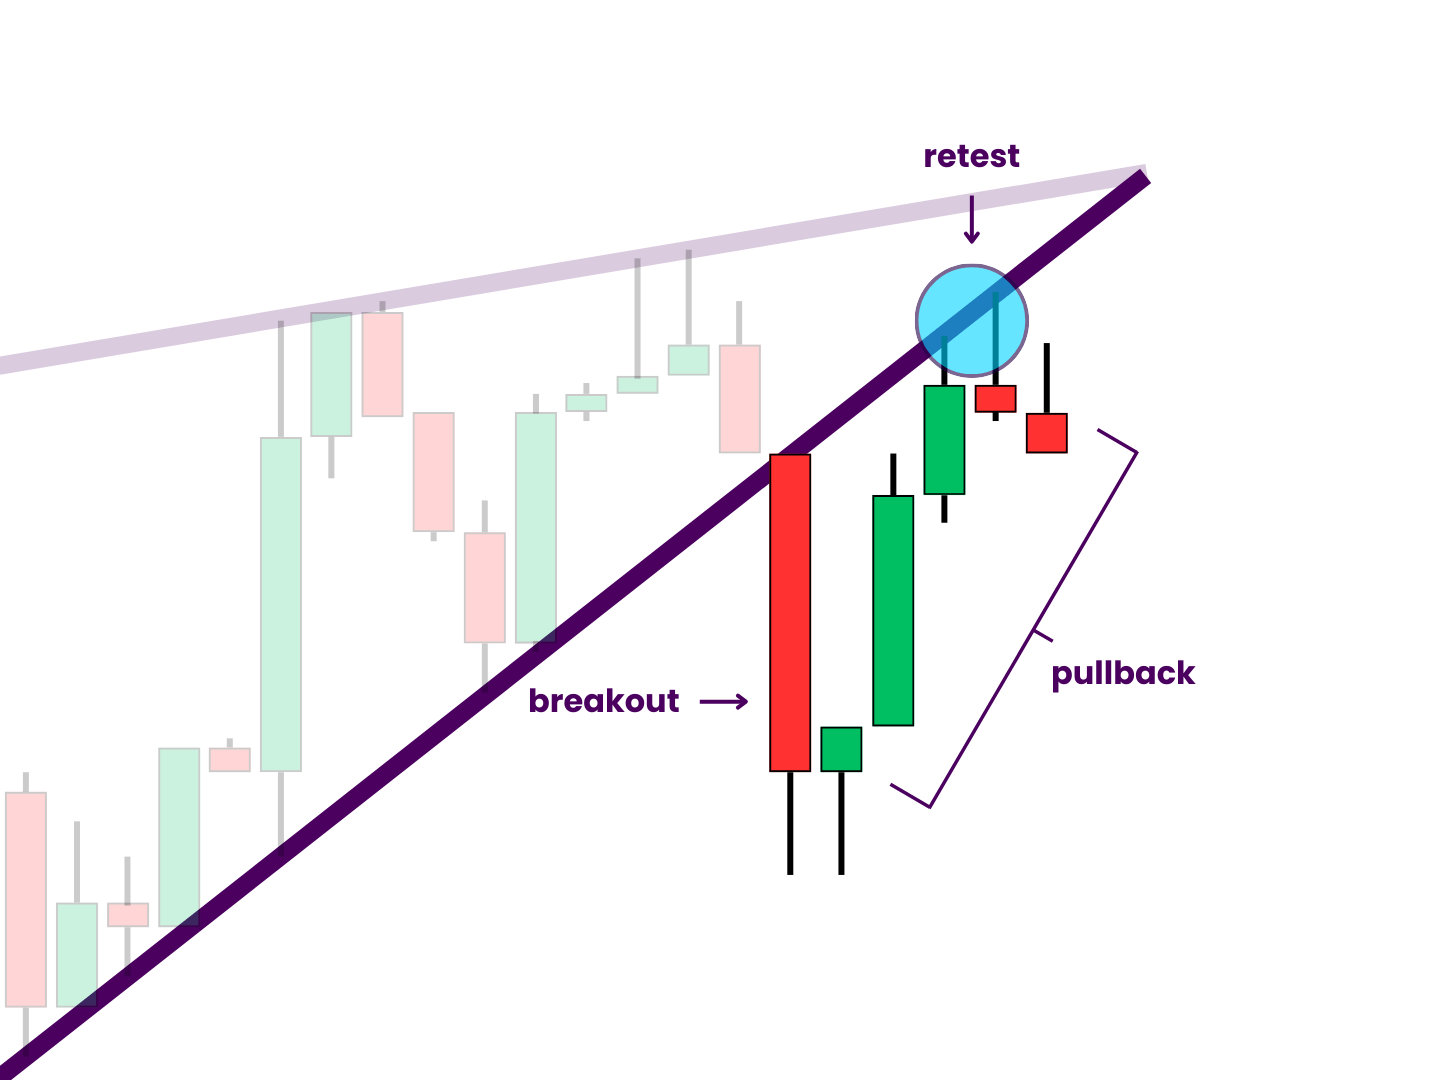
Criteria: The pullback must not close above the support-turned-resistance line. If it does, it invalidates the breakout. More conservative traders may even say that the pullback cannot close above the breakdown price.
Trading Volume
Volume is one of the most cited chart pattern validation and confirmation factors. Traders expect decreasing volume during consolidation and increasing volume during the breakout. Low volume on a breakout may be indicative of a fakeout.
Criteria: Trading volume should trend down at a rate that matches the length of the wedge. It should then break out of this trend at the same time the price does. Ideally, there would be a large volume spike followed by elevated volume until the target is met.
Where Ascending Wedges Fit in the Chart Narrative
The markets are often characterized as a battle between the bulls and the bears.
It’s like the charts have a story to tell.
Patterns are a natural progression from market cycles, trends, and price levels. They also build on the data from candlesticks and candlestick patterns (even though you can usually see them on a line chart).
However, chart patterns have an even larger impact on the chart narrative.
That’s partly because they tend to span longer periods of time and therefore carry more weight. But it is also due to their popularity. This is especially true of widely recognized patterns like the ascending wedge. Since they are so well-known, they usually attract interest from many parties.
This frequently foreshadows dramatic pieces of price action.
Rising Wedge Market Psychology
A rising wedge is a visualization of the psychology of the market.
It illustrates that the bulls have control but the bears may be ready to challenge them.
Imagine this scenario:
There is an ongoing downtrend, culminating in a massive sell-off. After a week of pain for the bulls, price finally reaches a strong level of historical support. Over the next few weeks, buyers get a much-needed relief rally. Price puts in a respectable new swing high before sinking back down. It sets a higher low and bounces again. It then scores a higher high before swinging the other way. This minor uptrend continues over the course of the next few months. However, the lows are rising faster than the highs. Bullish momentum is waning. And everyone can see it. Both sides prepare for the final showdown as the range squeezes tighter.
Sellers take the initiative, forcing price back down toward the bottom of the pattern for what looks like the final showdown.
It appears that the bears sense weakness while the bulls still hold out hope for more upside.
An impartial spectator may predict that the bears will strike a fatal blow here.
A gambler may bet on who they want to win.
A trader would find a way to profit no matter who wins.
You can picture this scenario anytime you see price being squeeze between rising trend lines. It could apply to any tradeable asset. However, no two wedges will have exactly the same story. Nor will they play out in exactly the same way. But true traders consider what both sides are thinking.
The frequency and performance of ascending wedges vary across markets. So study their historical performance on your preferred asset(s) and time frames specifically.
How To Chart Ascending Wedge Patterns
Before you can analyze ascending wedges, you need to be able to chart them.
Luckily, all you really need is basic chart markup skills.
If you need them, TradingView’s triangle tool and triangle pattern tool can be used to outline wedges. But they are also extremely easy to draw with trend lines and/or extended trend lines. That’s what you’ll see most traders use. They are more than adequate to map out all the important levels and decision zones.
Then, analyze the ascending wedge pattern with your favorite trading indicators and tools.
You may need to adjust or redraw your lines several times. When you’re new, it can be a bit like trying to read tea leaves. One ascending wedge can lead into a larger one. Or, a “failed” ascending wedge can evolve into an ascending channel or bear flag.
That’s why each pattern’s criteria is so important.
Like all technical analysis tools, chart patterns are just a framework for understanding price action.
You’ll need more in your arsenal to consistently make money with them.
How To Trade Rising Wedge Patterns
The basic concept for trading bearish wedges is very easy to understand.
As with all wedge patterns, you can get in on a breakout trade on either side of the formation.
The conventional bearish trade is:
- Step 1: Take a short trade if/when the price closes below the rising support line.
- Step 2: Place your stop loss just above the breakdown point.
- Step 3: Set your profit target based on your preferred rule.
The conventional bullish trade is:
- Step 1: Take a long trade if/when the price closes above the rising resistance line.
- Step 2: Place your stop loss just below the breakout point.
- Step 3: Set your primary profit target based on your preferred rule.
The clarity of these rules makes for a very tradeable pattern.
Plus, there are many things you can do to optimize its use.
Still, you probably shouldn’t aspire to be a “pattern trader.” Learning to use patterns is a great place to start. But you’ll eventually want (or need) to move on to more sophisticated strategies. These may use patterns, but not as the centerpiece. Luckily, traditional chart patterns are easy to integrate into many different trading styles.
A reliable trading strategy requires a dependable edge and calculated risk management. Learn trading math and order types well. Add some options and/or automation if you really want to cook.
However you choose to do your rising wedge trading, keep your rules strict.
Signals mean nothing without proper trade execution.
Step 1: Where & How To Enter Ascending Wedge Trades
By now, you should understand the basic entry.
You have multiple options to play the breakout straight.
You could watch the pattern and place a market order on the candle after the breakout. Or, you could forgo the candle watching by implementing price and/or volume alerts. You could even place a stop limit to buy the breakout automatically (though that does have its own risks).
Yet there is more you can do to get the best entry possible.
Leave It Late
Unlike some patterns (ie. ascending triangles), getting in early leads to a worse position than waiting for the breakout. Not only does leaving it late present a better risk/reward ratio, it directly increases your potential gains on short trades. As price rises higher, prospective percentages of downward moves increase.
Swing Into Position
Like channels, ascending wedges are one of the best patterns to swing trade. They are often huge and may even represent a self-contained uptrend. As they reach maturity, it can be advantageous to hold on to swing positions longer than usual. This is perhaps the only safe, simple way to get in early. It could even facilitate an early break-even stop loss. Still, this method is not without its risks.
Considered Confirmation
Where you assign confirmation can make a big difference to your risk/reward ratio. Volume, higher-term candle closes, candlestick patterns, and indicator signals are all legitimate options. Some traders may even wait to enter on a pattern retest (though this may not be as effective as it is with other types of patterns). Ideally, you’d back up your own choice with historical analysis.
Playing the “Fail”
Rising wedges that break up are as easy to trade as “successful” ones. You could even argue that they are easier to trade than downward breakouts. While choosing a price target can still be tricky, upward breakouts often lead to powerful trending moves. Some analysis even suggests that they perform far better than the expected breakdown. More often than not, the wedge’s shorter-term uptrend spills over into higher-term time frames when the bearish signal fails.
Step 2: Where & How To Exit Bearish Wedge Trades
Bearish wedges are one of the most well-known chart patterns.
This often leads to increased trading activity.
However, there is no true consensus on their price targets. This leads to uncertainty in terms of breakout magnitude. Instead of one or two levels to focus on, traders must be more flexible to account for the disparate possibilities.
As always, it’s crucial to know your gameplan going into every trade.
Frontrunning
Underlying support may stall price, or prevent it from reaching the target altogether. Make note of prior levels, important moving averages, and other potential obstacles. Conservative bears may take profits here. Aggressive bulls may look for longs. Both of these exert pressure against the breakout. In response, you could consider locking in some or all your gains here too. Identify these levels and establish your contingency plans in advance.
Staying Exposed
If you’re more patient, you can opt to stay in the trade, giving price more time to reach the target. After all, if the target on either side gets met, the greater trend could follow suit. By using a trailing stop loss, you may be able to stay exposed in a risk-free trade. This is why ascending wedges can lay the foundations of longer-term positions.
Breaking It Up
You could also do all of the above by deploying different chunks of capital in different ways. For example, you might sell a portion at a primary profit target, then set a break-even stop loss and let the rest ride. This is especially relevant in secular bear markets or when you have your own bearish thesis concerning the asset in question. Beware though. This hybrid trading/investing approach can make it hard to keep your P&L in perspective.
Step 3: Where & How To Stop-Loss Rising Wedge Trades
You also have options when it comes to stop-losses.
The initial stop loss is typically placed in one of three locations. First, you can place it on the other side of the newly broken trend line. Second, you can place it on the other side of the last swing high or low. Third, you can place it on the other side of the pattern. (The last two may or may not be the same level.)
It partly comes down to your risk tolerance. Tighter stops lower potential losses. But they can also lead to premature exits.
Whatever you do, just don’t freewheel it.
Get in the habit.
Set. Stops. (Even if they are loose.)
Moreover, how you use them should match your overall strategy.
Trailing Stop Loss
Some traders prefer trailing stop losses. This more passive technique allows you to lock in unrealized gains without exiting. Instead of cashing out, shadow the trend with your stop loss. Lesser pullbacks, moving averages, Fibonacci extension levels, and other minor levels are all options. If you’re well in the money or trading long-term, you could even go with a fixed percentage. It is such a common practice that some trading platforms and tools allow you to automate it. Sure, it can make you susceptible to stop hunts. But that’s better than losing money.
Break Even Stop Loss
Break-even stop losses are meant to do one thing. They prevent you from taking an L from a winning position, which is one of the worst feelings in trading. As soon as it is appropriate, move your stop loss down to a level that ensures you can’t lose money. You’ll be able to do it earlier if your position originates from an intra-pattern swing trade. Otherwise, you may have to wait until some sort of post-breakout support or resistance. This strategy is a great way for newer traders to keep confidence high. It can also protect you from false breakouts.
Other Chart Pattern Types
The rising wedge pattern operates in the same way as many others.
It has similar rules to triangles and other patterns that include flagpoles. As a consolidation pattern and bearish chart pattern, it is also a distribution pattern. Additionally, it shares traits with most other chart continuation patterns.
It is a good idea to study more of these patterns and their relationships.
The vast majority of them are worth learning about.
- Adam and Eve Patterns
- Ascending Triangle Patterns
- Bear Flag Patterns
- Cup and Handle Patterns
- Descending Triangle Patterns
- Descending Wedge Patterns
- Double Bottom Patterns
- Double Top Patterns
- Head and Shoulders Patterns
- V Bottom Patterns
- W Patterns
At the very least, you should do a deep dive on the most popular and common ones. Then, skim the rest of the list if you must. You don’t have to commit every single one to memory.
However, learning about different chart patterns has big advantages. It will help you find more trading opportunities. Perhaps more important, it will expose you to many proven trading ideas. More important still, it will teach you a lot about price action, market psychology, and more.
In the end, how patterns help elucidate the story in the charts is even more useful than the signals they provide.
True traders always consider contingencies for whatever the market brings anyway.
Takeaways
To review:
The rising wedge is a bearish distribution pattern.
- It is characterized by rising, converging support and resistance.
- It gives a bearish bias and acts as a continuation signal most often.
- The standard trade is a breakout trade below the support line or above the resistance line.
- Ascending wedge patterns are common and well-known but nuanced and sometimes difficult to identify.
- They are easy to incorporate into many types of trading strategies but aren’t the best performers.
- They are popular among new traders, breakout traders, and pattern traders.
Like all chart patterns, bearish wedges don’t guarantee anything. However, they do hint at upcoming possibilities. They also come with a proven trading framework. What’s more, you can study more patterns to find even more opportunities.
Patterns may not be a silver bullet, but they are a useful weapon in your trading arsenal.
Have questions or more information to add? Contribute to the conversation in the comments below! Or, if you know someone who could benefit from this post, share it with them. You can also check out our Chart Patterns Guide to improve your chart analysis skills.

0 Comments