So you want to learn about candlestick patterns that show up during bullish continuation, huh?
Smart choice.
Identifying bullish continuation can help you find opportunities for winning trades. These patterns can help you do just that.
Bullish Continuation Candlestick Patterns
- Bullish In Neck
- Bullish Mat Hold
- Bullish On Neck
- Upside Tasuki Gap
- Rising Three Methods
- Rising Window
Identifying Bullish Continuation Candlestick Patterns
Candlestick patterns that signal bearish continuation are very distinct.
Not only do they signal that market conditions are likely to remain the same, they also imply a direction.
Of course, they do not guarantee that the uptrend is going to last. But do hint at more downward movement to come.
However, most candlestick patterns hover around a 50% hit rate. So they are not a “sure thing” by any means. Still, traders look for them for a reason.
Even when they fail, they can act as a indication of the opposite. That’s one reason why it is helpful to learn about all of the types of candlestick patterns—including bullish reversal patterns, bearish continuation patterns, and bearish reversal patterns.
More than anything, it might be best to look at them as points of interest.
Plus, learning about them increases your overall understanding of price action.
This is technical analysis, after all.
It may not be easy but it is lucrative.
Bullish In Neck
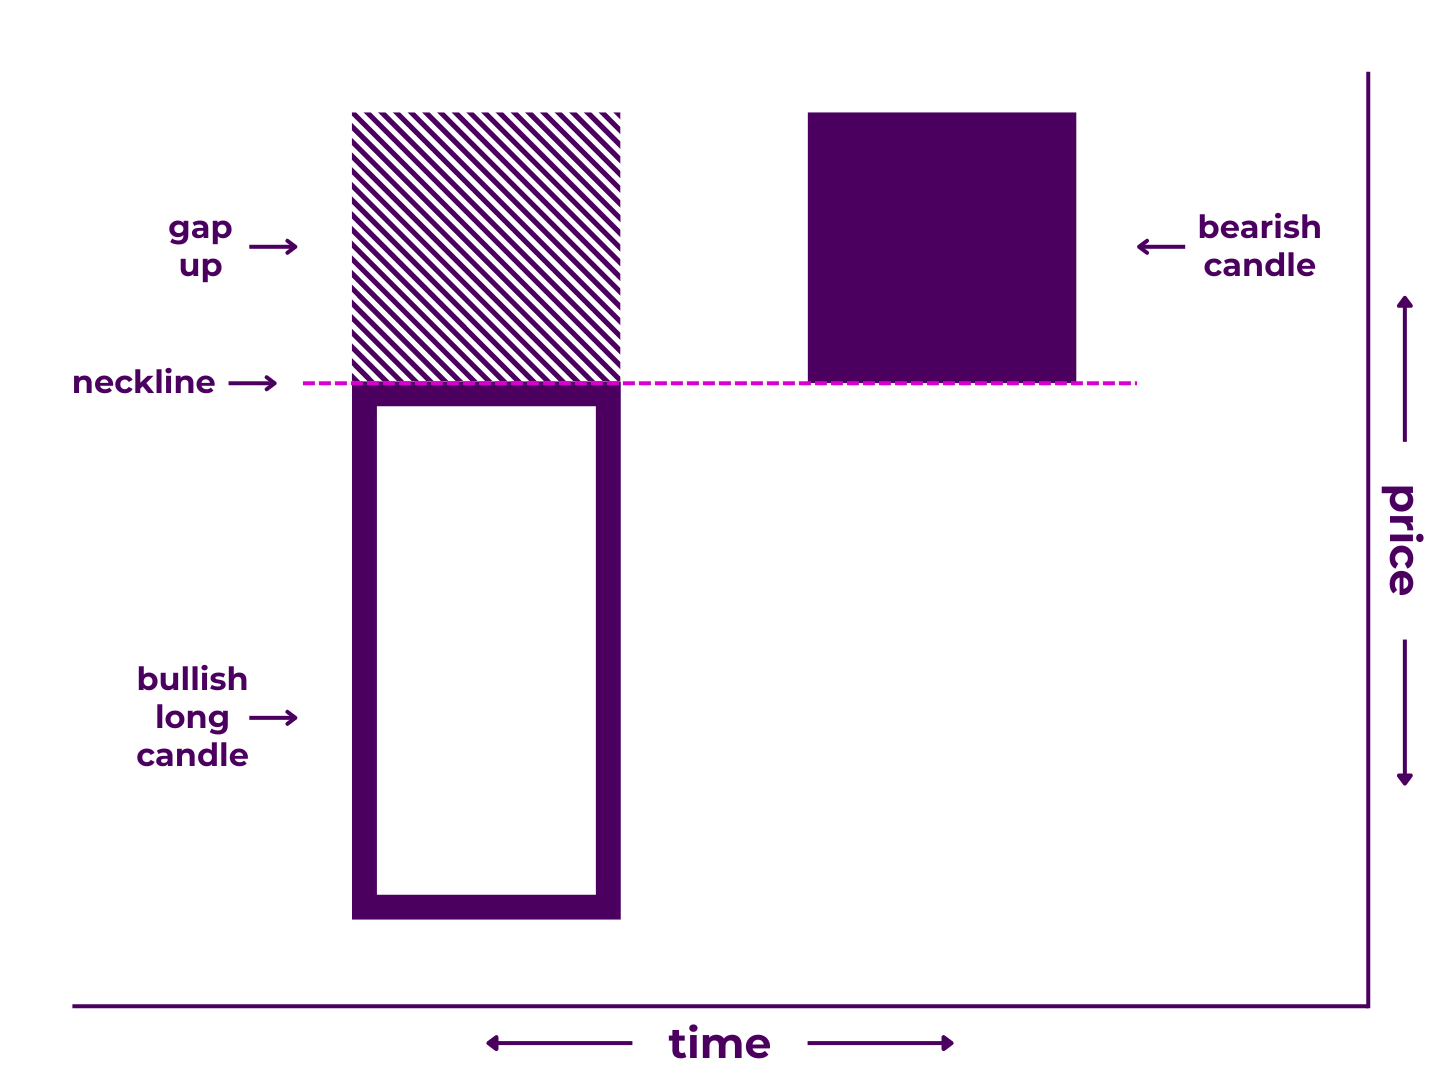
A bullish in neck pattern is a 2-candlestick formation that may signal a bullish continuation.
It may appear in an uptrend and is made up of a large bullish candle followed by a gap up and smaller bearish candle that fills the gap and closes near the close of the first candle.
In trading terms:
- During the first period, price continued the pre-existing uptrend.
- The second period opened with a modest gap up but price moved back down, filled the gap, and closed at the same price as the first period.
Bullish in neck patterns show that the bulls attempted to press their advantage on candle one and between candles one and two, but then allowed some reprieve by the end of candle two.
Pattern Type: Bullish Continuation
Number of Candlesticks: 2
Looks Like/Narrative Meaning: a pause in the action or rallying point
Technical Specifications***
Technically, a bullish in neck pattern must:
- Appear during an uptrend
- Begin with a bullish long candle
- Have a gap up after the first candle
- End with a bearish candle that fills the gap and closes even with the top of the first candle’s body
In practicality though, many traders will make various exceptions.
- The first candle doesn’t necessarily have to be a long candle, as long as its body is longer than the body of the second candle.
- The close of the second candle can be slightly above or below the close of the first candle.
- It can take two candles to fill the gap, as long as the combined body length of the second and third candles is shorter than the length of the first.
***Depending on who you ask, any of these standards may be more or less important. Moreover, some of these variations may be more properly classified as other bearish candlestick patterns.
Related Patterns
- Similar to Bullish Counterattack Lines Pattern
- Similar to Bullish On Neck Pattern
- Subtype of In Neck Pattern
- Opposite of Bearish In Neck Pattern
For more detail, read our full breakdown on Trading Bullish In Neck Candlestick Patterns.
Bullish Mat Hold
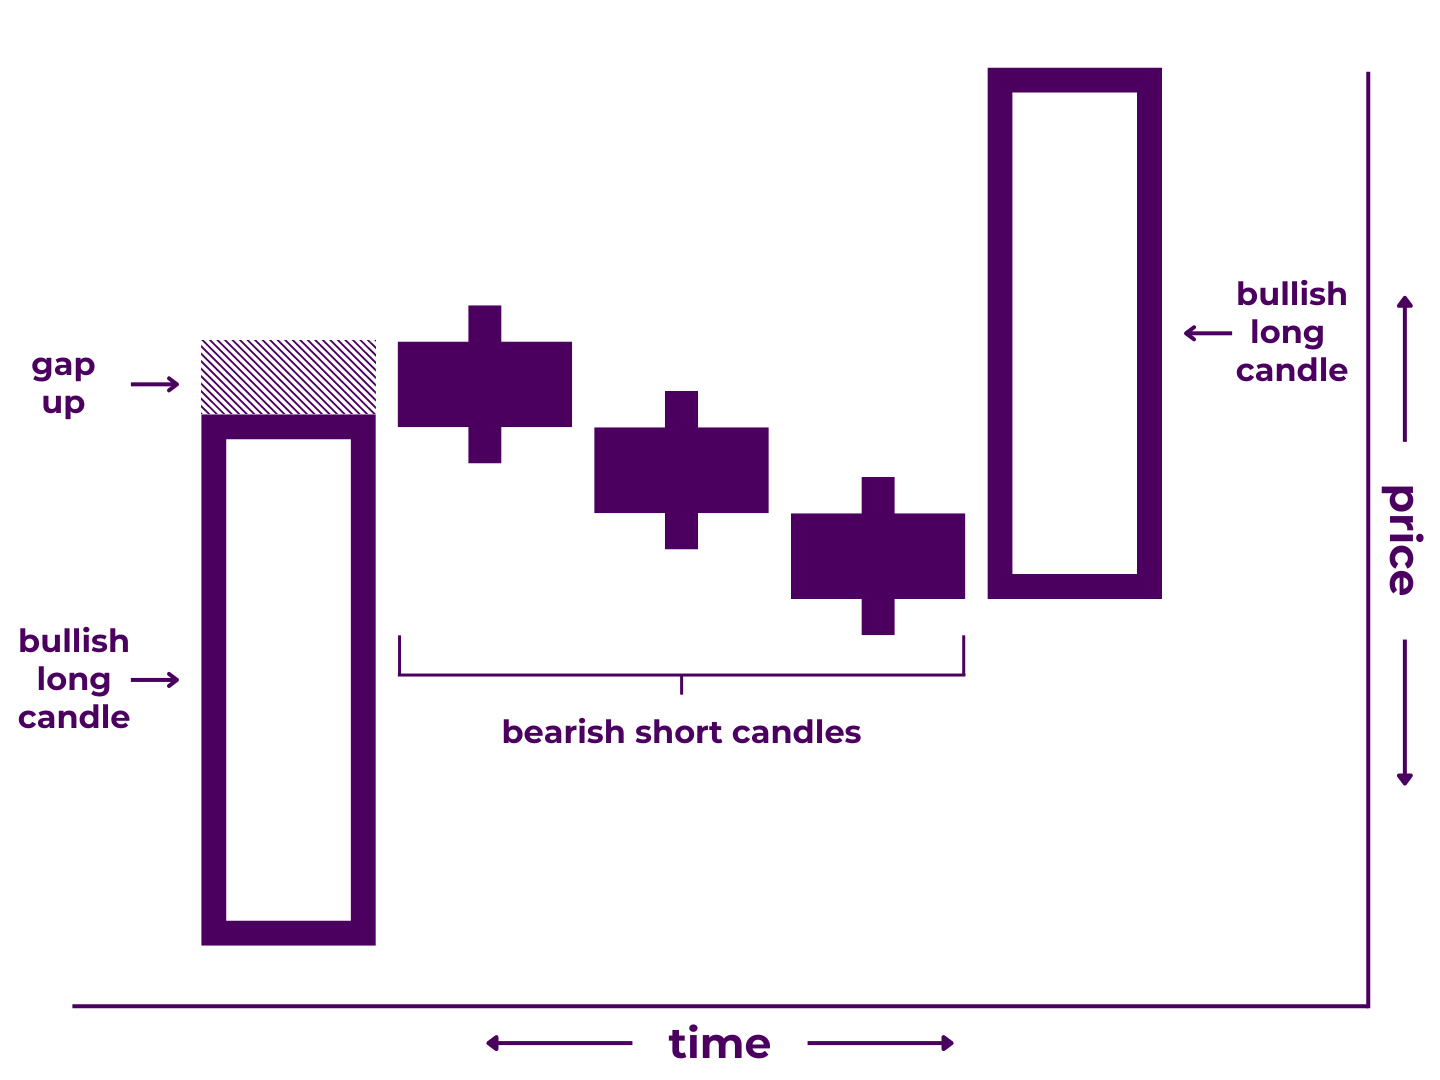
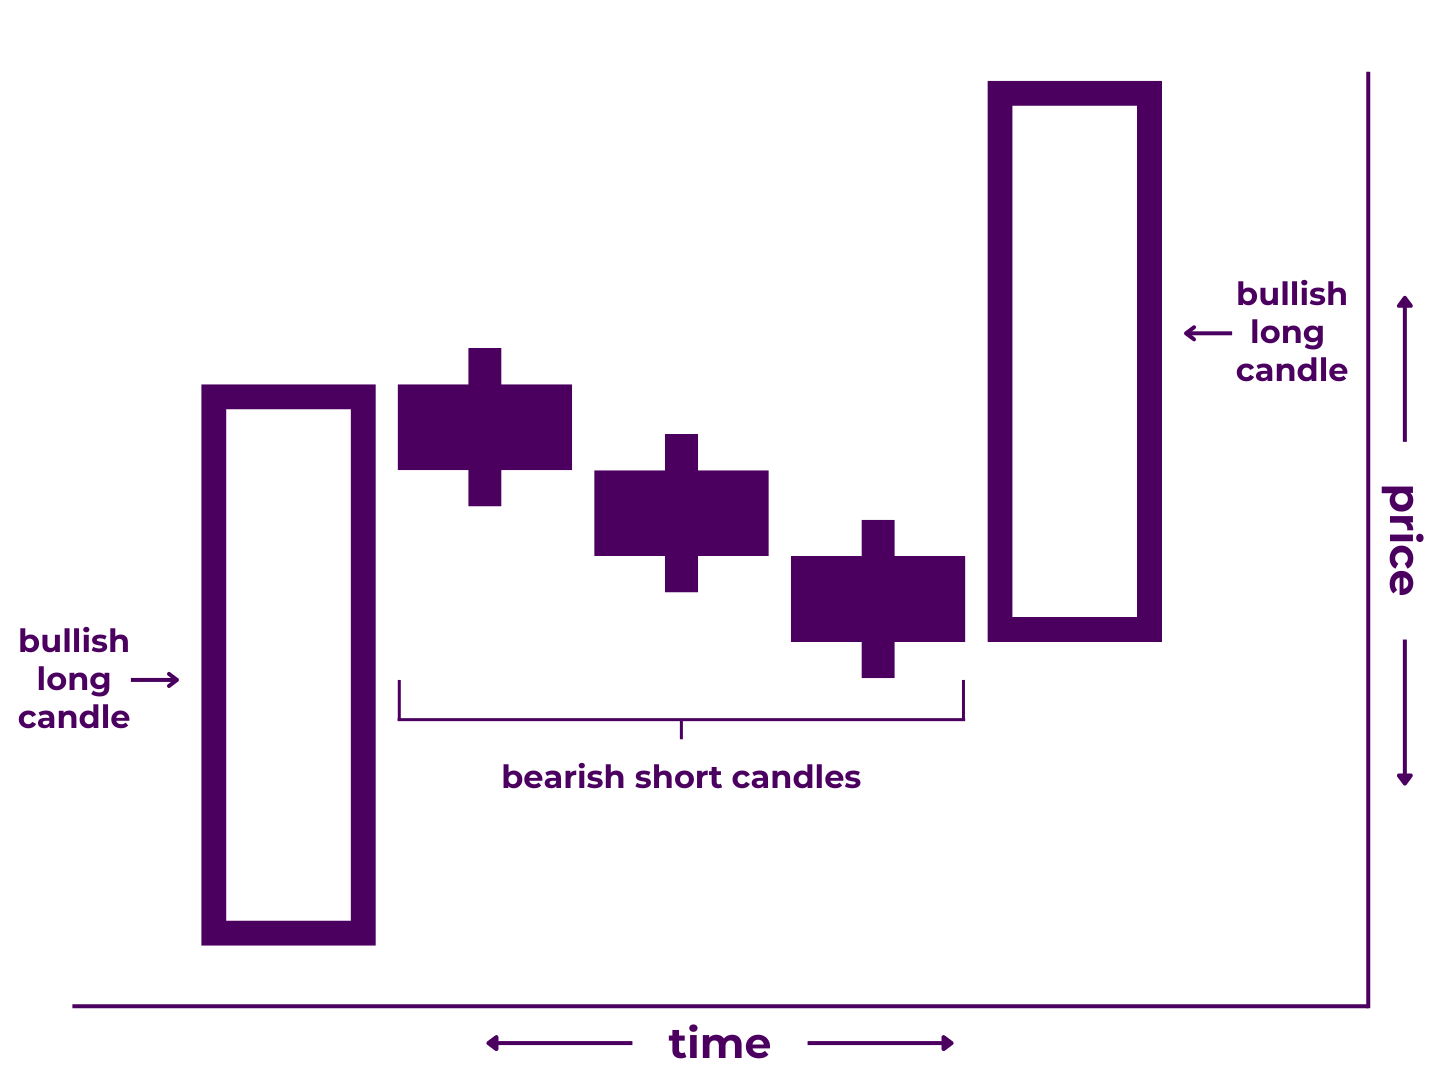
A bullish mat hold pattern is a 5-candlestick formation that may signal a bullish continuation.
It may appear in an uptrend and is made up of a large bullish candlestick followed by a gap up and three smaller bearish (or neutral) candles that fill the gap but never close below the first candle’s open, then another large bullish candle that closes above all previous candles.
In trading terms:
- During the first period, price continued the pre-existing uptrend.
- The second period opened with a gap up that was filled over the course of the next three periods as price moved back down but never closed lower than the first period’s open.
- During the fifth period, price resumed upward movement and closed higher than any of the preceding four periods.
Bullish mat hold patterns show that the bulls attempted to press their advantage on candle one (and between candles one and two), stalled for the next three candles, before finally regaining control and pressing trend further by the end of the fifth candle.
Pattern Type: Bullish Continuation
Number of Candlesticks: 5
Looks Like/Narrative Meaning: a one-sided beatdown or near-knockout blow
Technical Specifications***
Technically, a bullish mat hold pattern must:
- Appear during an uptrend
- Begin with a bullish long candle
- Have a gap up after the first candle that gets filled over the course of the next three candles
- Have three consecutive bearish (or neutral) short candlesticks after the first candlestick that never close below the open of the first candlestick
- End with another bullish long candlestick that closes above the body and wicks of all preceding candlesticks in the pattern
In practicality though, many traders will make various exceptions.
- The first candle doesn’t necessarily have to be a long candle, as long as its body is longer than candles two, three, and four.
- The middle three candles don’t necessarily have to be short candles, as long as all of them are shorter than candle one.
- One or more of the middle candles can be bullish, as long as the gap gets filled before the fifth candle begins.
- There can be more than three candles between the first and last candles, as long as the gap gets filled and none of the middle candles close outside the body of the first.
- The gap can go, especially in markets where gaps are less common, like cryptocurrency.
- The final candle doesn’t necessarily have to close above all of the wicks of the prior candles, as long it closes above their bodies.
***Depending on who you ask, any of these standards may be more or less important. Moreover, some of these variations may be more properly classified as other bearish candlestick patterns.
Related Patterns
- Similar to Rising Three Methods Pattern
- Subtype of Mat Hold Pattern
- Opposite of Bearish Mat Hold Pattern
For more detail, read our full breakdown on Trading Bullish Mat Hold Candlestick Patterns.
Bullish On Neck
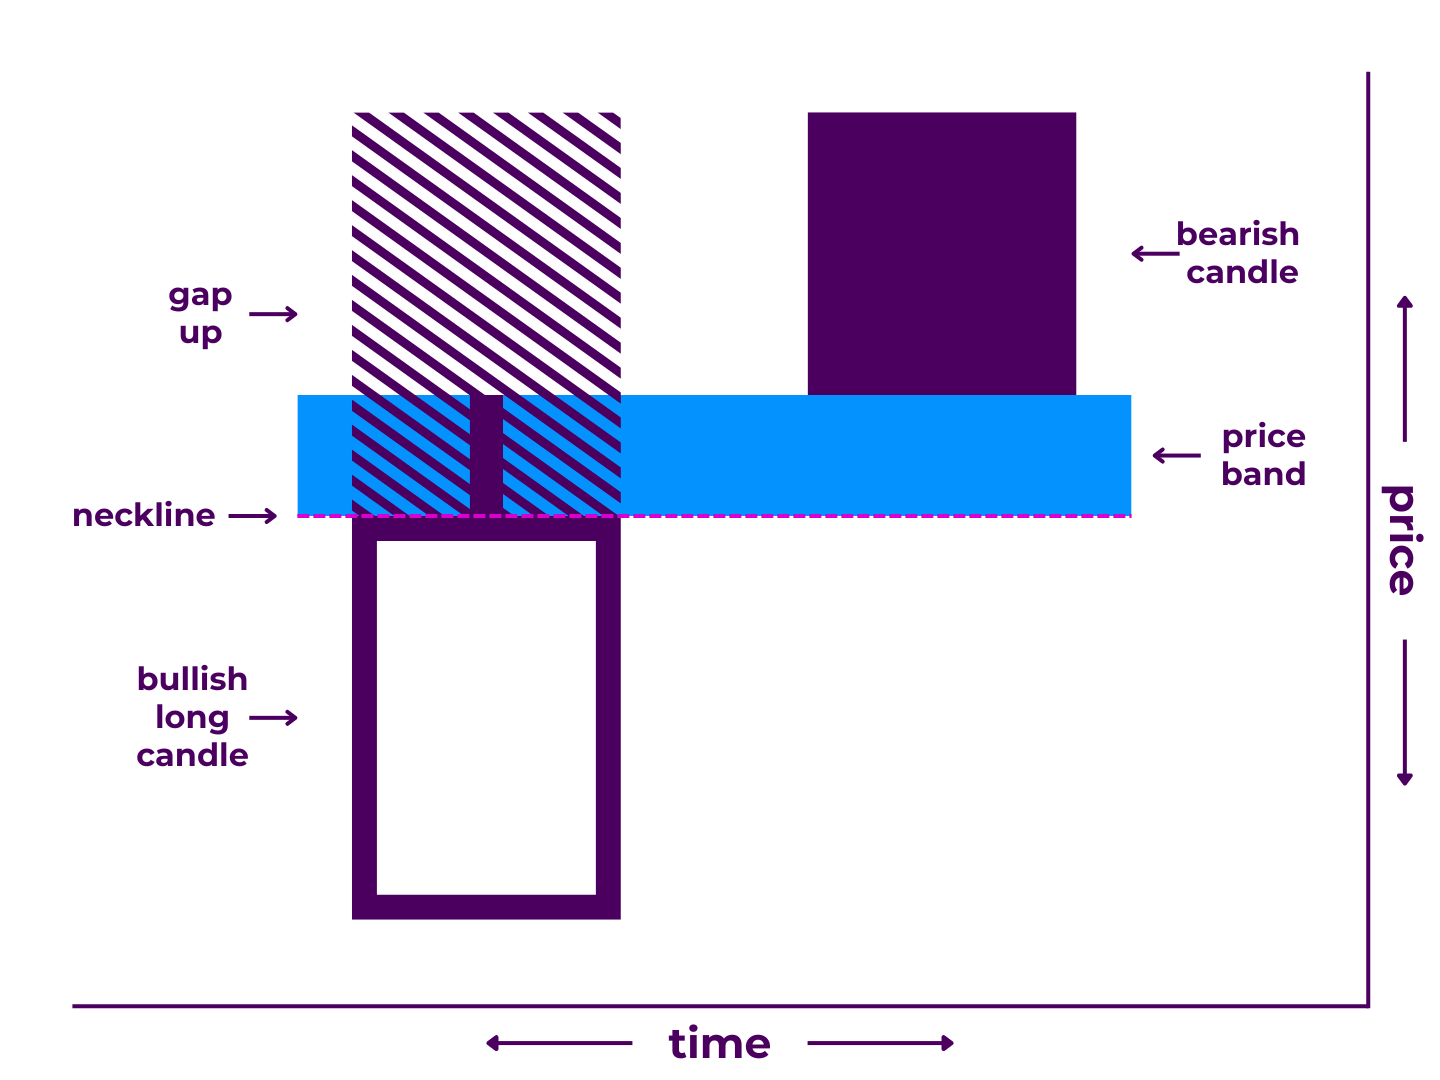
A bullish on neck pattern is a 2-candlestick formation that may signal a bullish continuation.
It may appear in an uptrend and is made up of a large bullish candle followed by a gap up and a smaller bearish candle that partially fills the gap and closes near the high of the previous candle.
In trading terms:
- During the first period, price continued the pre-existing uptrend.
- The second period opened with a gap up above the first period’s high, then moved back down, partially filled the gap, and closed at the same price as the first period’s high.
Bullish on neck patterns show that the bulls attempted to press their advantage on candle one and between candles one and two, then held their ground fairly well over the course of candle two.
Pattern Type: Bullish Continuation
Number of Candlesticks: 2
Looks Like/Narrative Meaning: “no man’s land” or a mustering line
Technical Specifications***
Technically, a bullish on neck pattern must:
- Appear during an uptrend
- Begin with a bullish long candle that has an upper wick, such as a bullish belt hold.
- Have a gap up after the first candle that exceeds the upper wick of the first candle
- End with a bearish candle that partially fills the gap and closes even with the upper wick of the first candle
In practicality though, many traders will make various exceptions.
- The first candle doesn’t necessarily have to be a long candle, as long as its body is longer than the body of the second candle.
- The first candle doesn’t necessarily have to have an upper wick, as long as there is a gap that is only partially filled by the next candle.
- The close of the second candle candle be slightly above or below the upper wick of the first candle, as long as it does not get too near the close of the first candle.
- It can take two candles to reach the upper wick of the first candle, as long as the combined body length of the second and third candles is shorter than the body of the first candle.
***Depending on who you ask, any of these standards may be more or less important. Moreover, some of these variations may be more properly classified as other bearish candlestick patterns.
Related Patterns
- Similar to Bullish Counterattack Lines Pattern
- Similar to Bullish In Neck Pattern
- Subtype of On Neck Pattern
- Opposite of Bearish On Neck Pattern
For more detail, read our full breakdown on Trading Bullish On Neck Candlestick Patterns.
Upside Tasuki Gap
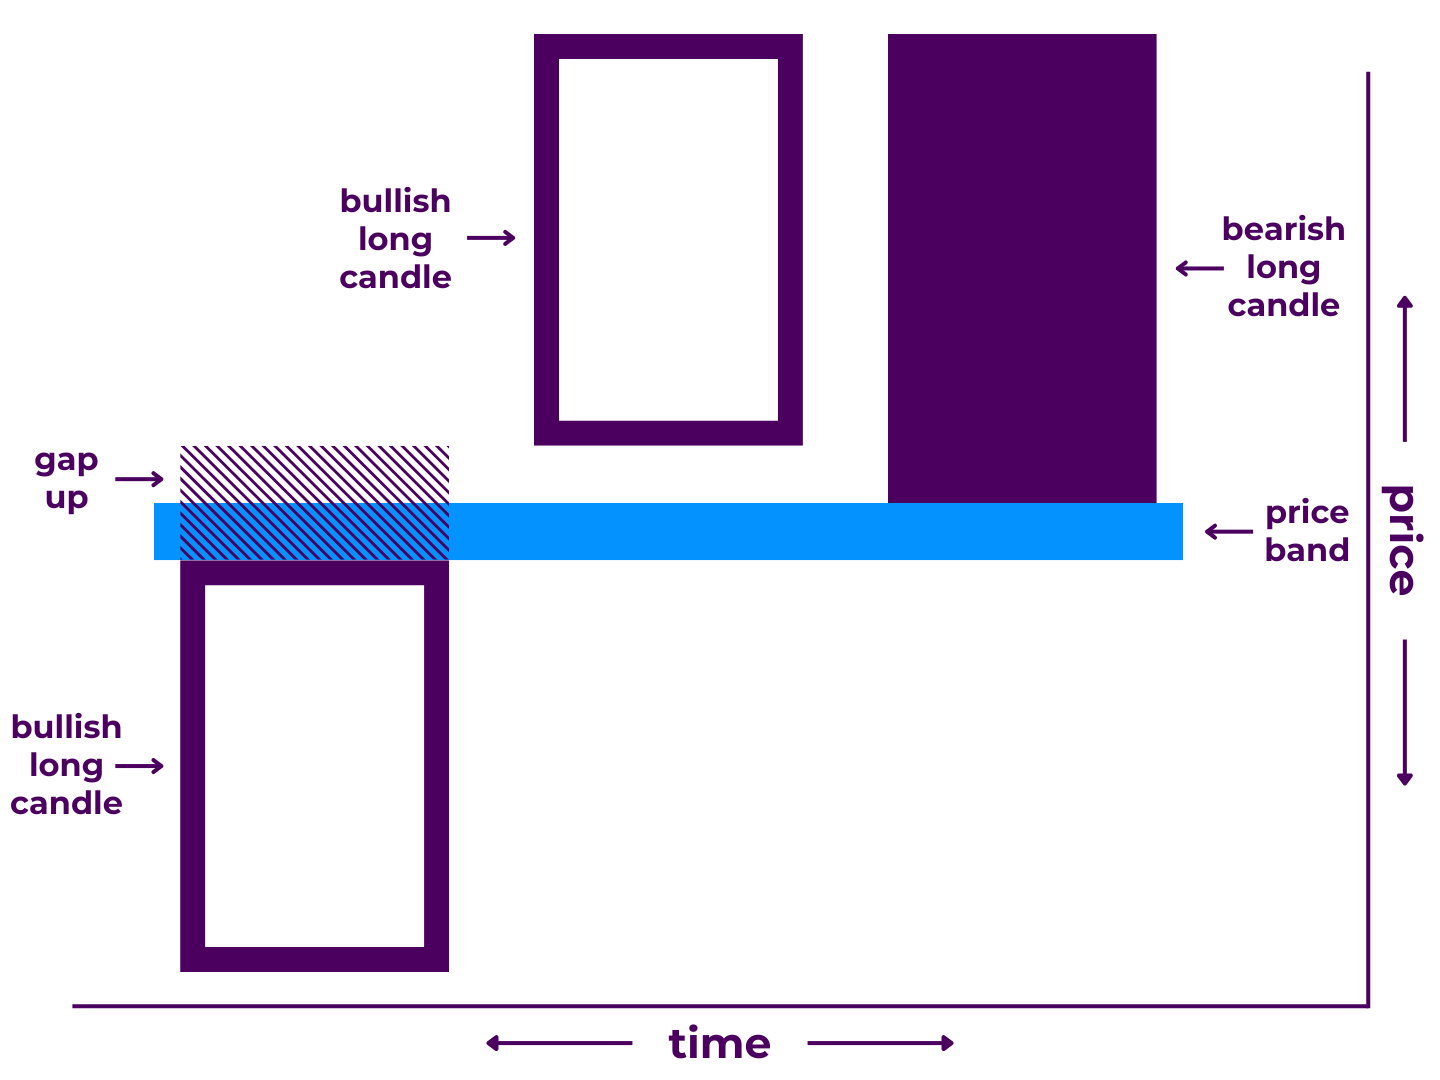
An upside tasuki gap pattern is a 3-candlestick formation that may signal a bullish continuation.
It may appear during an uptrend and is made up of a large bullish candle, a gap up, and another large bullish candle, followed by a bearish candle that partially closes the gap between the first two.
In trading terms:
- During the first period, price continued the pre-existing uptrend.
- The second period opened with a gap up and continued driving upward.
- During the third period, price moved back down and closed somewhere in the middle of the gap.
Upside tasuki gap patterns show that the bulls pressed their advantage on candle one, continued between candles one and two, continued further through the end of candle two, until finally suffering a relatively minor setback on candle three.
Pattern Type: Bullish Continuation
Number of Candlesticks: 3
Looks Like/Narrative Meaning: a momentary respite or an attempted counterattack
Technical Specifications***
Technically, an upside tasuki gap pattern must:
- Appear during an uptrend
- Begin with a bullish long candle
- Have a gap up after the first candle
- Have another bullish long candle after the gap
- End with a bearish long candle that partially fills the gap
In practicality though, many traders will make various exceptions.
- The first candle doesn’t necessarily have to be a long candle, as long as it is a candlestick that gives a strong bullish bias (such as a gravestone doji).
- The second candle doesn’t necessarily have to be a long candle, as long as it is bullish and does not fill the gap.
- The third candle doesn’t necessarily have to be a long candle, as long as it doesn’t fully fill the gap.
- The third candle doesn’t have to fill the gap at all, as long as it moves against trend.
- It can take multiple bearish candles to reach the gap, as long as all other criteria are met and the gap remains partially unfilled.
***Depending on who you ask, any of these standards may be more or less important. Moreover, some of these variations may be more properly classified as other bearish candlestick patterns.
Related Patterns
- Extension of Rising Window Pattern
- Subtype of Tasuki Gap Pattern
- Opposite of Downside Tasuki Gap Pattern
For more detail, read our full breakdown on Trading Upside Tasuki Gap Candlestick Patterns.
Rising Three Methods
A rising three methods pattern is a 5-candlestick formation that may signal a bullish continuation.
It may appear in an uptrend and is made up of a large bullish candlestick, three smaller bearish (or neutral) candles that never close below the first candle’s open, then another large bullish candle that closes above all previous candles.
In trading terms:
- During the first period, price continued the pre-existing uptrend.
- During the next three periods, price moved down but never closed lower than the first period’s open.
- During the fifth period, price resumed upward movement, and closed higher than any of the preceding four periods.
Rising three methods patterns show that the bulls attempted to press their advantage on candle one, stalled for the next three candles, before finally regaining control and pressing trend further by the end of the fifth candle.
Pattern Type: Bullish Continuation
Number of Candlesticks: 5
Looks Like/Narrative Meaning: one-sided beatdown or near-knockout blow
Technical Specifications***
Technically, a rising three methods pattern must:
- Appear during an uptrend
- Begin with a bullish long candle
- Have three consecutive bearish (or neutral) short candlesticks after the first candlestick that never close below the open of the first candlestick
- End with another bullish long candlestick that closes above the body and wicks of all preceding candlesticks in the pattern
In practicality though, many traders will make various exceptions.
- The first candle doesn’t necessarily have to be a long candle, as long as its body is longer than candles two, three, and four.
- The middle three candles don’t necessarily have to be short candles, as long as all of them are shorter than candle one.
- One or more of the middle candles can be bullish, as long as all of them close within the range of candle one.
- There can be more than three candles between the first and last candles, as long as none of the middle candles close outside the body of the first.
- The final candle doesn’t necessarily have to close above all of the wicks of the prior candles, as long it closes above their bodies.
***Depending on who you ask, any of these standards may be more or less important. Moreover, some of these variations may be more properly classified as other bearish candlestick patterns.
Related Patterns
- Similar to Bullish Mat Hold Pattern
- Subtype of Three Methods Pattern
- Opposite of Falling Three Methods Pattern
For more detail, read our full breakdown on Trading Rising Three Methods Candlestick Patterns.
Rising Window
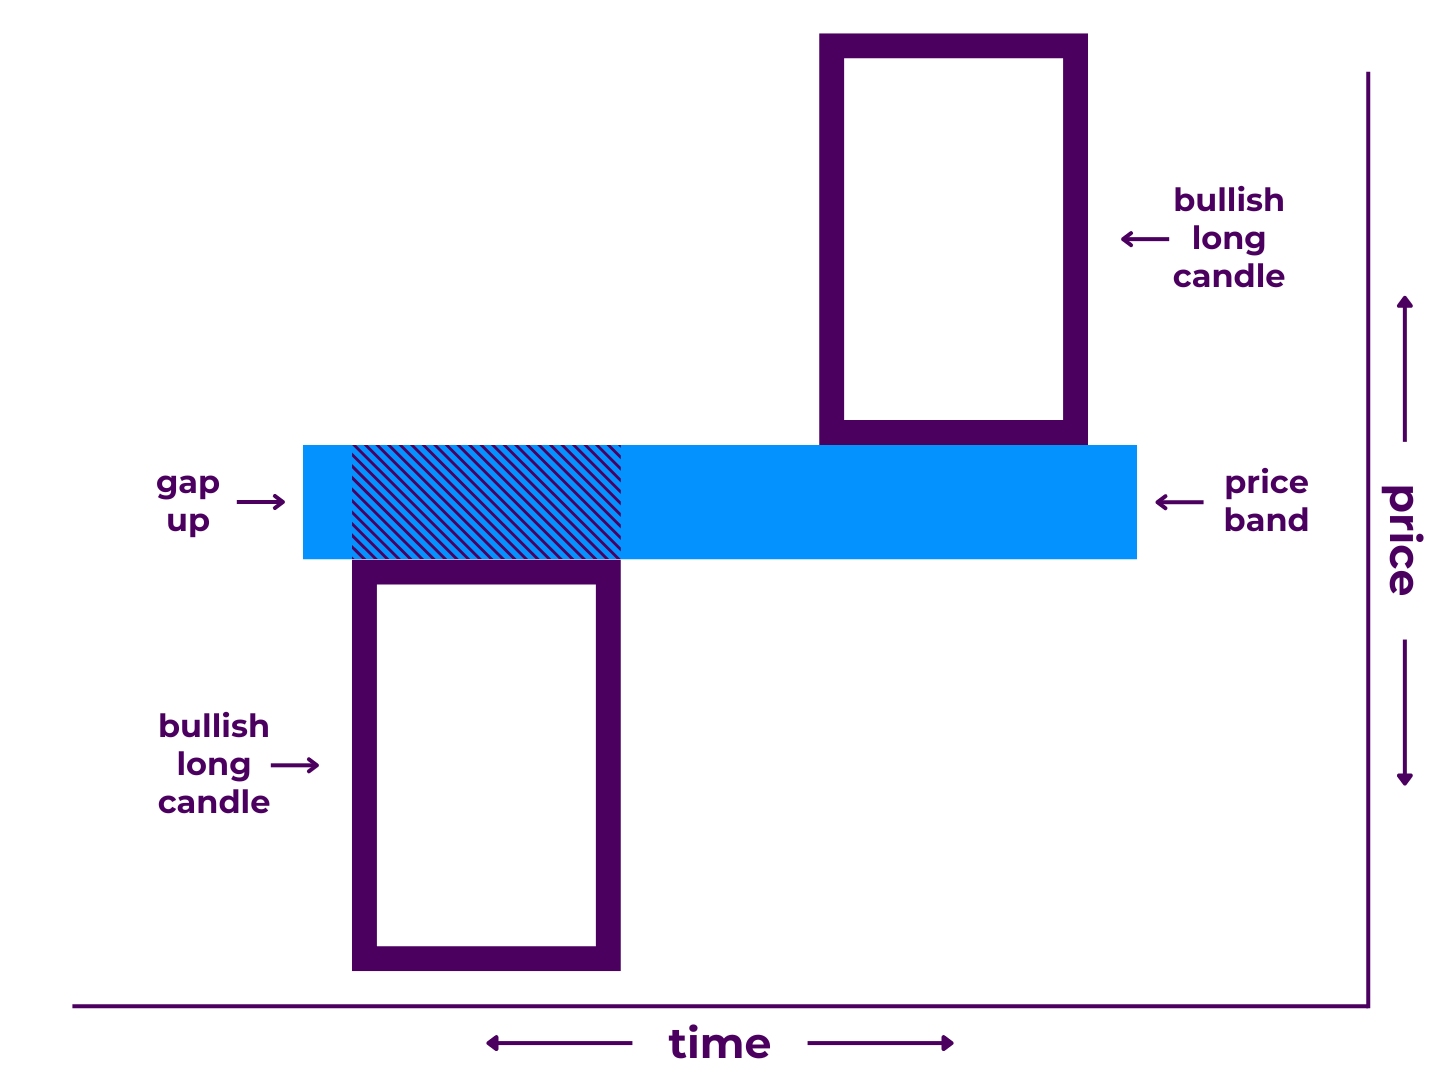
A rising window pattern is a 2-candlestick formation that may signal a bullish continuation.
It may appear during an uptrend and is made up of two large bullish candles with a gap between them.
In trading terms:
- During the first period, price continued the pre-existing uptrend.
- The second period opened with a gap up and continued driving upward.
Rising window patterns show that the bulls pressed their advantage on candle one, continued between candles one and two, and continued further through the end of candle two.
Pattern Type: Bullish Continuation
Number of Candlesticks: 2
Looks Like/Narrative Meaning: a runaway train or uncontested offensive
Technical Specifications***
Technically, a rising window pattern must:
- Appear during an uptrend
- Begin with a bullish long candle
- Have a gap up after the first candle
- End with another bullish long candle
In practicality though, many traders will make various exceptions.
- The first candle doesn’t necessarily have to be a long candle, as long as it is a candlestick that gives a strong bullish bias (such as a dragonfly doji).
- The second candle doesn’t necessarily have to be a long candle, as long as it is bullish and does not fill the gap.
***Depending on who you ask, any of these standards may be more or less important. Moreover, some of these variations may be more properly classified as other bearish candlestick patterns.
Related Patterns
- Precursor of Upside Tasuki Gap Pattern
- Subtype of Window Pattern
- Opposite of Falling Window Pattern
For more detail, read our full breakdown on Trading Rising Window Candlestick Patterns.
Takeaways
As you can see, there are many different bullish candlestick continuation patterns.
Luckily, you don’t have to memorize them all to become a successful trader. Learning the principles of price action and technical analysis are far more important. However, studying candlestick patterns is one of the best ways to do so.
In the end, understanding candle patterns is but one piece of the trading puzzle. You’ll need more weapons at your disposal to understand how to win the battle of the charts. Still, by learning the different types of candlestick patterns, you’re one step closer to creating a complete trading strategy.
Know of an important candlestick pattern we missed? Have some special insight into trading a specific pattern? Contribute to the conversation in the comments below! Or, share this post with a trader it might help. And if you haven’t already, check out our Candlestick Patterns Guide to learn the best ways to trade candlestick patterns.

0 Comments