So you want to learn about bullish candlesticks, huh?
Smart choice.
Recognizing signs of bullish conditions in the market is a useful skill all traders should master.
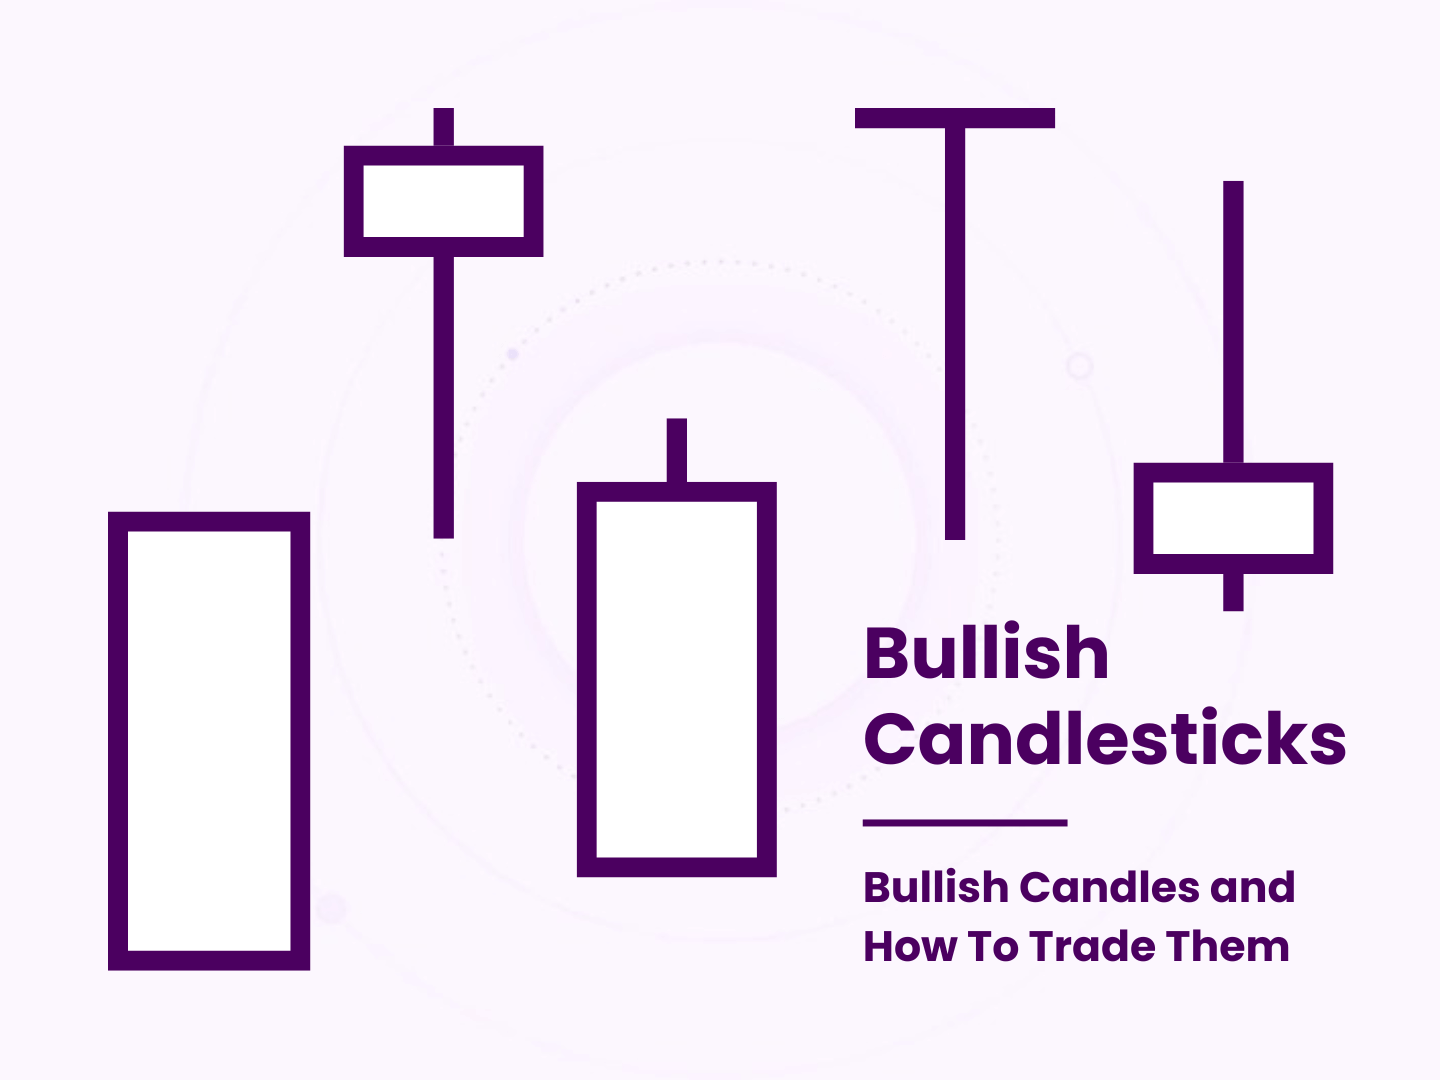
Here, we will go over the 5 different types of candlesticks that may signal bullish sentiment.
Bullish Candlestick Types
Let’s jump into it.
Bearish Candlesticks
Different types of candlesticks imply different biases.
Some candlesticks signal potential bearish price action. Others signal potential bullish price action (like the ones highlighted in this post). Yet others signal potential market indecision.
Key word:
Potential.
That’s why it can seem slightly misleading to label candlesticks this way. To make predictions based on an individual candlestick is folly. Remember, a candlestick is a representation of a single time period in the past.
Bullish candles only tell you that buyers maintained control (or at least finished with control) during the time period of the candle. They do not guarantee that that bullishness will continue into future price action.
However, these labels do exist for a reason.
Certain types of candlesticks are often spotted preceding bullish reversals or during bullishly trending moves.
These are what we call bullish candlesticks.
Bullish Belt Hold
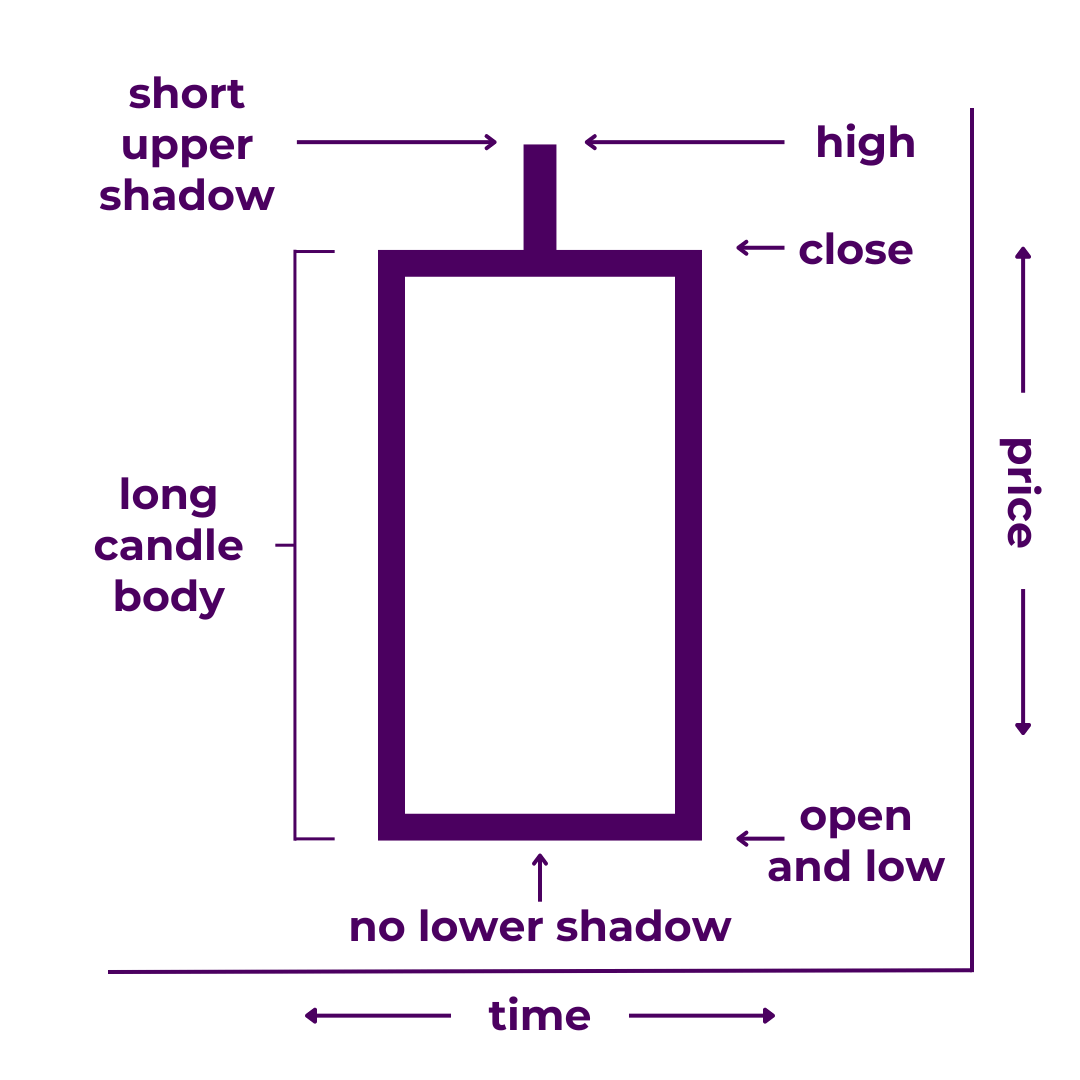
A bullish belt hold (or “yorikiri”) is a long candlestick with a short upper shadow and no lower shadow.
It indicates that the open and low prices match and are far below the close and high prices. In trading terms, a bullish yorikiri shows that the price rose from the open considerably and closed near the high for that time period.
A bullish belt hold candlestick paints a picture of near-total dominance. On the chart, it looks like non-stop price movement for an entire period. With such a large body, the color of the candle always stands out. You can almost hear the bulls cheering, “We’ve got them on the ropes!” while the bears cry, “Please, no more!”
Technical Specifications
Technically, bullish yorikiri should not have a lower wick at all. Some traders may even attempt to assign criteria to the length of the body or lower wick. For most though, this is total overkill.
What’s more:
Some traders contend that it’s not officially a bullish belt hold unless it appears at the end of a downtrend, signaling a bullish reversal—which would make it more of a multi-candlestick pattern.
Sentiment: Strong Bullish
Look for Them During
- Volatile Periods
- Trending Moves
- Reversals
Related Candlesticks
- Opposite of the Bearish Belt Hold
- Subtype of Long Candlestick
- Similar to Marubozu Candlesticks
Read our full breakdown of Bullish Belt Hold Candlesticks.
Bullish Marubozu
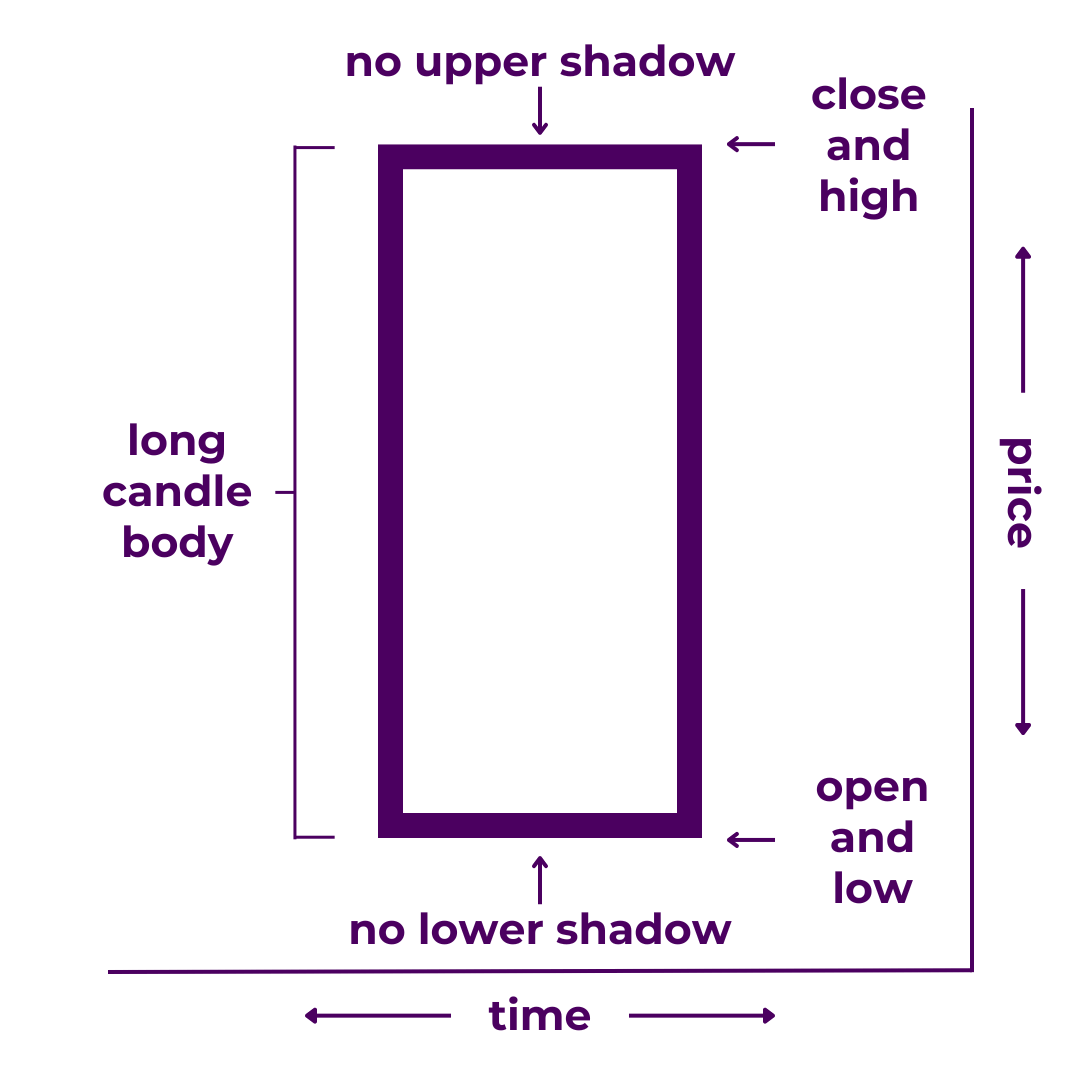
A bullish marubozu is a long green (or white) candlestick without shadows.
It indicates that price opened at the low and closed at the high of a large trading range. In trading terms, a bullish marubozu candle signals dominance for the buyers.
A bullish marubozu candlestick paints a picture of overwhelming positive momentum. On the chart, it looks like non-stop bullish price movement for an entire period. Without any wicks, the color of the candle always stands out. Bullish marubozu seem to scream, “To the moooon.”
Technical Specifications
Technically, bullish marubozu shouldn’t have any wicks at all. However, “perfect” marubozu are comparatively rare. If the wicks are insignificant, you can basically treat it like a marubozu. All types of bullish long candles have roughly the same implications anyway.
Sentiment: Strong Bullish
Look for Them During
- Trending Moves
- Reversals
- Volatile Periods
Related Candlesticks
- Subtype of Long Candlestick
- Similar to Bearish Belt Hold
- Similar to Bullish Belt Hold
Dragonfly Doji
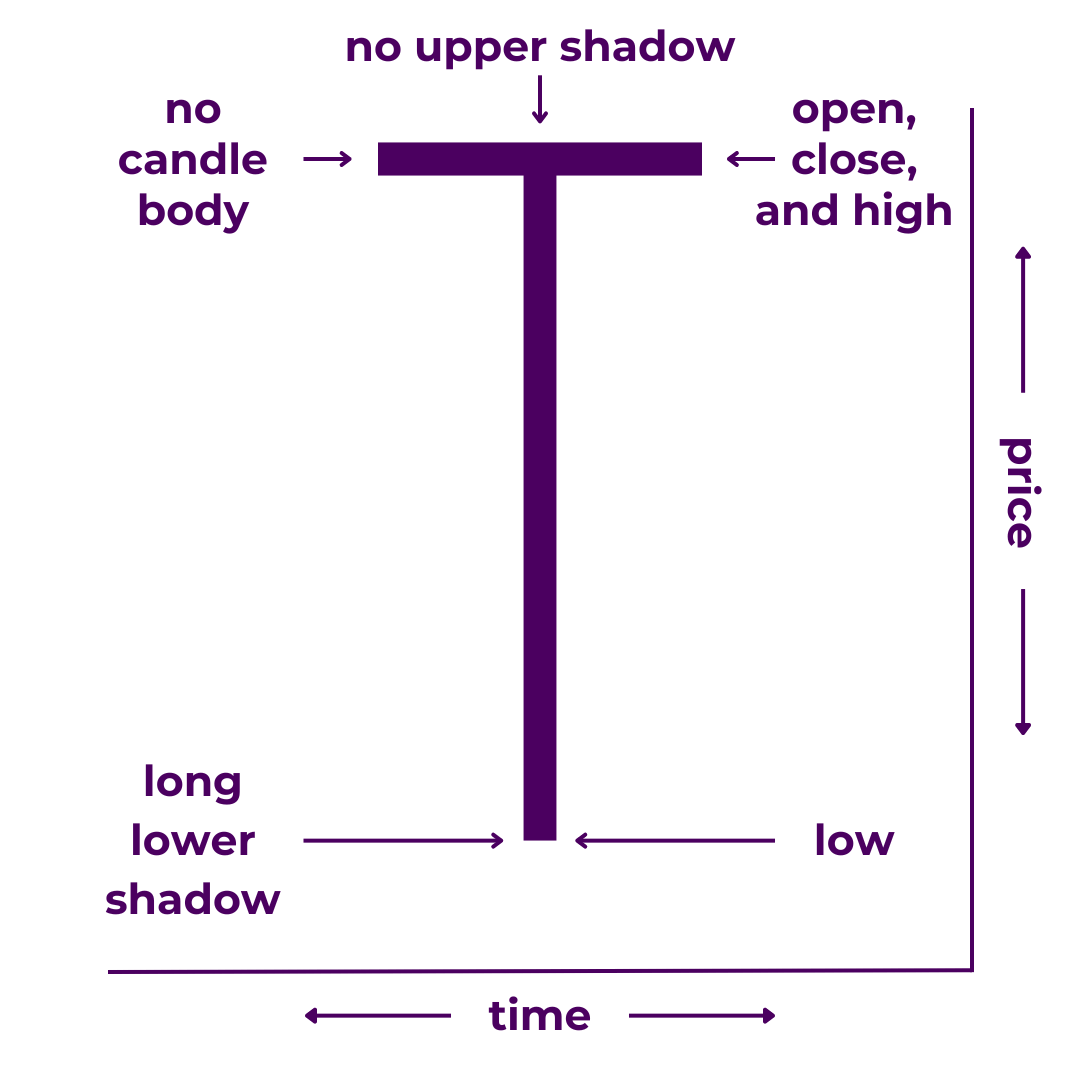
A dragonfly doji is a candlestick with no real body, no upper shadow, and a long lower shadow.
It indicates that open and close prices are the same and at the top of the trading range. In trading terms, a dragonfly doji candle signals bullish momentum.
Dragonfly doji paint a picture of potential lift off. Without a candle body, the long lower wick usually stands out most. On the chart, it looks like the bulls are ready to win the tug-o-war. Meanwhile, the bears cling on for dear life crying, “Not yet!”
Technical Specifications
Technically, doji should have the exact same opening and closing prices. In practical application though, “perfect” dragonfly doji are comparatively rare. If the body is insignificant, you can treat it like a doji (though it may arguably be a hammer or similar).
Sentiment: Strong Bullish
Look for Them During
- Bottoming Formations
- Reversals
- Trending Moves
- Volatile Periods
Related Candlesticks
- Subtype of Doji
- Opposite of Gravestone Doji
- Similar to Hammers
- Similar to Hanging Men
- Same Implications as Inverted Hammers
Read our full breakdown of Dragonfly Doji Candlesticks.
Hammer
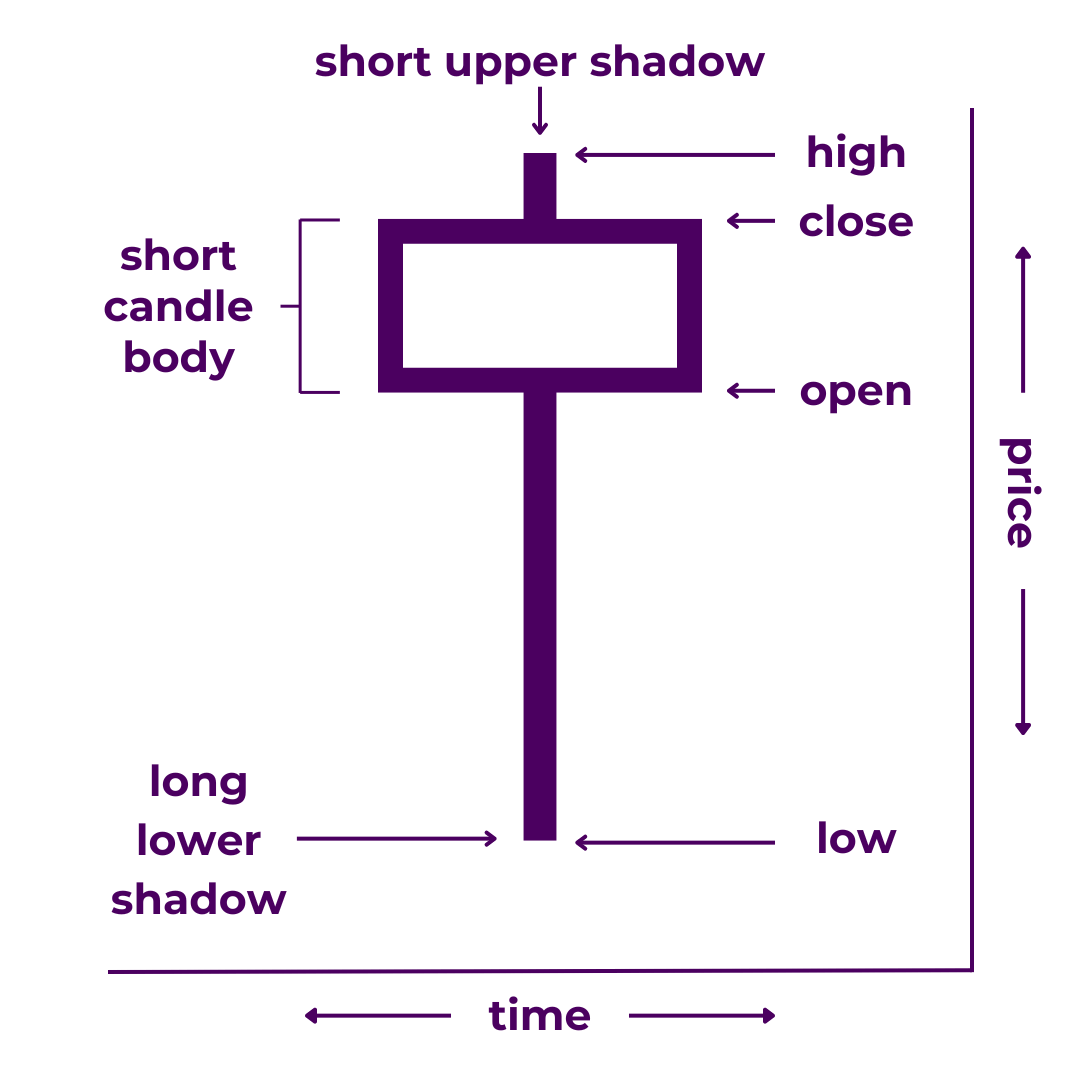
A hammer is a candlestick with a short real body, little to no upper shadow, and a longer lower shadow.
It indicates that the open and close prices are close together and near the top of the trading range. In trading terms, a hammer candle signals that the bulls may be gaining strength.
Hammers paint a picture of a trend running out of steam. With a short body, the long lower wick usually stands out most. On the chart, it looks like the bears attempted to push prices lower but the bulls said, “Not so fast.”
Technical Specifications
Technically, the lower wick should be at least twice as long as the body. It doesn’t matter what color the body is. But if the body is negligible or nonexistent, it would instead be classified as a dragonfly doji.
Furthermore, some would say that it is only a hammer if it appears at the end of a downtrend, leading to a bullish reversal—which would make it more of a multi-candlestick pattern.
Sentiment: Strong Bullish
Look for Them During
- Bottoming Formations
- Reversals
- Volatile Periods
Related Candlesticks
- Opposite of Shooting Stars
- Similar to Dragonfly Doji
- Similar to Hanging Men
- Same Implications as Inverted Hammers
Read our full breakdown of Hammer Candlesticks.
Inverted Hammer
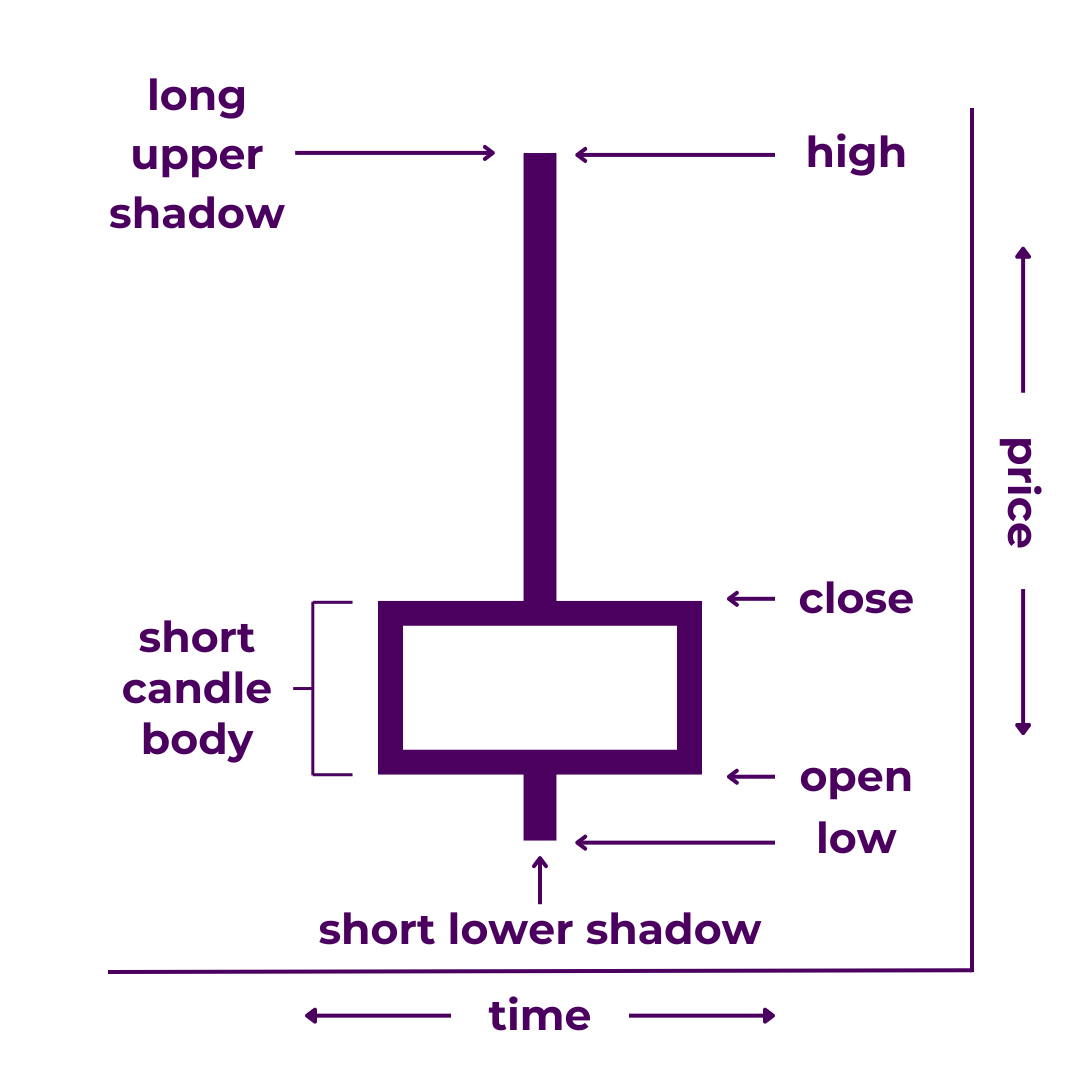
An inverted hammer candlestick is a candlestick with a short body, little to no lower shadow, and a longer upper shadow.
It indicates that the open and close prices are close together and near the bottom of the trading range. In trading terms, an inverted hammer candle signals that the bulls are trying to resist continuation of a bearish trend.
Inverted hammers paint a picture of a last stand. With a short body, the long upper wick usually stands out most. On the chart, it looks like the bulls attempted to reverse the trend but the bears replied, “Not so fast.”
Technical Specifications
Technically, the upper wick should be at least twice as long as the body. It doesn’t matter what color the body is. But if the body is negligible or nonexistent, it should instead be classified as some type of doji.
Furthermore, some would say that it is only an inverted hammer if it appears at the end of an downtrend, leading to a bullish reversal—which would make it more of a multi-candlestick pattern.
Sentiment: Bullish
Look for Them During
- Bottoming Formations
- Reversals
- Trending Moves
- Volatile Periods
Related Candlesticks
- Opposite of Hanging Man
Read our full breakdown of Inverted Hammer Candlesticks.
Takeaways
Obviously, there are a ton of different candlestick types.
However, you don’t have to memorize all the names and exact specifications. Instead, focus on the principles behind the analysis. That way, you’ll see what is going on with any candlestick, whether it fits into one of these categories or not.
At the end of the day, understanding candlesticks is but one piece of the puzzle. You’ll need more tools in the toolkit to read the full story in the charts—and even more than that if you want to put together a complete trading strategy.
Have questions? Know of an important candlestick type we missed? Have some special insight into trading a specific type? Contribute to the conversation in the comments below! Or, if you know someone who could benefit from this post, share it with them. You can also check out our Japanese Candlesticks Guide to improve your candlestick analysis skills.

0 Comments