You must be pretty smart.
Japanese candlestick charts are the most popular way to graph price action. By extension, candlestick patterns are commonly used as trading signals. They help you understand the story in the charts.
Let’s start with some definitions.
What Are Candlestick Patterns
Candlestick patterns are specific formations of candles on Japanese candlestick charts that traders use to find profitable trades. They are made up of one or more candlesticks with defined criteria and are often present at inflection points in the market.
They are predominantly used as signals of a potential reversal or continuation of trend. Most of them have both bullish and bearish variations. This makes them prime points of interest, especially for shorter-term traders.
There are quite a few different types of candlestick patterns worth learning about.
But don’t get ahead of yourself!
Without a firm grasp on how candlesticks work, candlestick patterns won’t make much sense. If you haven’t already read our breakdown on how Japanese candlesticks work, go read it now.
If you have, let’s dive in.
How Candlestick Patterns Work
Understanding candlestick patterns is the easy part.
Learning where they fit in the price action narrative and then how to make money with is where things get difficult.
Nonetheless, you have to start somewhere.
The first thing you need to know about candlestick patterns is this:
Candlestick patterns require specific types of candlesticks in a specific order. Each of these candlesticks must fulfill certain criteria based on the individual pattern.
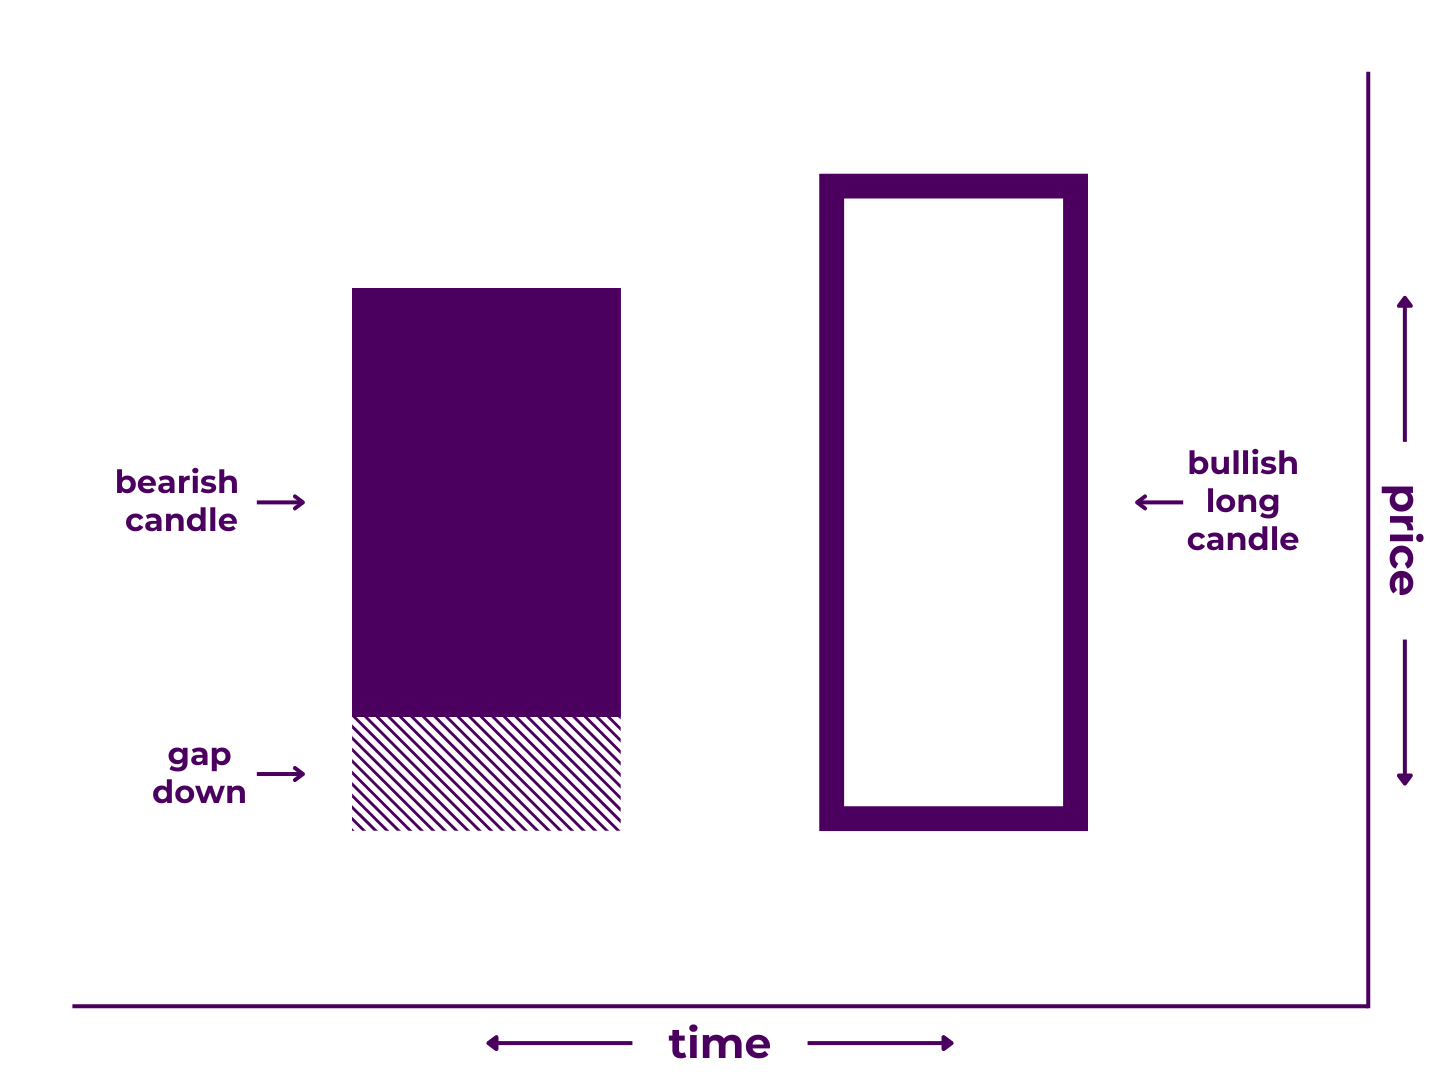
For example, the engulfing pattern must:
- Begin with a long candle moving with pre-existing trend
- End with a long candle that 1) opens with a gap in the direction of trend, 2) moves against trend, and 3) closes beyond the open of the first.
It can seem a little bit tedious at first, but looking through the various types of candlestick patterns can teach you a lot about price action. They help you construct a multi-period story that may define the next market phase.
Certain patterns are known for showing up regularly at inflection points in the market, like reversals and continuations. That’s why some traders use them as signals, though many of them have a low efficacy when used on their own.
Theoretically, you can label any combination of candlesticks as a pattern. In fact, you could conceivably find your own patterns that no one has labeled yet.
However, trading the “famous” ones gives you the added benefit of putting you on the side of the crowd. In other words, it increases the likelihood that others will detect the pattern and enter the same trade. This increases buying pressure or selling pressure on your side of the trade, ostensibly putting the odds in your favor.
So what are they made of?
Components of Candle Patterns
There are several components of a candlestick pattern.
Any given pattern will require its own criteria for the candlesticks contained within it.
These criteria define four main things.
- Candlestick(s) – In addition to the number of candlesticks, the criteria will often dictate the size, direction, open, close, wicks, and other aspects of each candlestick. These are typically stringent, with only a few, small concessions.
- Gaps and Inside Opens – Many patterns have requirements that include gaps and/or inside opens. Sometimes, these can be more flexible (especially in markets where gaps and inside opens are less common, like cryptocurrency).
- Pre-Pattern Trend – The determination of reversal or continuation depends on a pre-existing trend. Therefore, all patterns have a pre-existing trend requirement. If the formation occurs without that trend, it technically does not earn the pattern label.
- Post-Pattern Trend – The implication of a pattern is that the trend will continue or reverse afterwards. If this does not happen, it becomes a “failed” pattern. Most patterns fail 30-50% of the time.
In addition, virtually all patterns create price levels and/or ranges of interest, which we call decision zones. Traders often use these levels when setting pass and fail conditions on pattern signals. These levels also form (or reinforce) support and resistance.
Used correctly, this can be extremely powerful.
How To Read Candlestick Patterns
If you understand candlesticks, you’re 90% of the way to understanding candle patterns.
And just like individual candlesticks, you should wait on completion before making any decisions based on them. Never enter or exit a trade based on a half-baked pattern.
They don’t mean anything until they are finished.
Once they are though, they can be quite valuable.
What Candlestick Patterns Mean
Candlestick patterns encapsulate the meaning of each of their component parts.
This gives them both a mathematical and psychological connotation.
On one hand, they outline exact data points inherent to each candlestick. In other words, they highlight things like the change in price during each specific time period.
On the other hand, you can surmise the mind of the market through them. For example, a pattern may demonstrate a major shift in control from buyers to the sellers (or vice versa) over the course of several candles. Or, they may demonstrate that one side has a complete stranglehold on momentum.
Many patterns look like they mean exactly what you would expect, though not all of them.
In general, reversal patterns tend to illustrate a turning of the tables. They usually look like a dramatic change in direction. Likewise, continuation patterns tend to affirm the status quo. They usually look like one-way traffic.
Yet many seasoned traders consider them direction agnostic. That’s because when a reversal pattern fails, it often leads to continuation (or vice versa). Other times, patterns will lead to consolidation (aka. “sideways” price action).
Perhaps most important are those decision zones we touched on before. The levels set by candlestick patterns are prime areas for entries, exits, stop losses, or general position management adjustments.
This can be a major boon to those who recognize them.
Types of Candlestick Patterns
There are over 100 different candlestick patterns and several ways to categorize them.
The simplest would be to group them based on how many candles they are made of.
For example:
- 2-candlestick patterns
- 3-candlestick patterns
- 4-candlestick patterns
- 5-candlestick patterns
But it’s more useful to group them based on their implications.
There are two basic things they can imply:
- Direction – There are both bearish candlestick patterns and bullish candlestick patterns.
- Market Phase – There are both candlestick reversal patterns and candlestick continuation patterns.
Then you can cross-reference these to come up with more detailed segments:
Depending on what assets you prefer to trade, you can also focus on candlestick patterns with gaps or candlestick patterns without gaps.
For most people, trying to commit them all to memory would be a bit overwhelming. Luckily, that is unnecessary unless you’re trying to become a “pattern trader” (which we generally advise against).
Instead, it would probably be more effective to open a list of candlestick types, candlestick patterns, and chart patterns in another tab for reference.
Rote memory will not necessarily help you become a profitable trader. Understanding what price structures convey will.
Even then, that’s only one piece of the puzzle.
How To Make Money with Candlestick Patterns
Now, you should have a strong understanding of how candlestick patterns work.
It’s time to start talking about how to make money.
In its simplest form, it’s a two step process.
- Learn how to interpret the story in the charts.
- Develop a complete trading strategy.
Candlestick patterns mainly help you with the former.
However, you need more to see the full picture.
Reading the Story in the Charts
The concept of price action is fairly straightforward.
Mastering its interpretation is not.
Candlestick patterns are one of the first building blocks of technical analysis, the art and science of evaluating price action.
As it relates to the story in the charts, candlestick patterns are something like a plot device. They often appear at the turning point, climax, or resolution of an asset’s story. In this way, they may function as omens of things to come, whether positive or negative.
They reveal more about price action than single candlesticks but less than most longer-term chart patterns (though you could argue that they are equally actionable). Look at them as a multi-period description of events.
Whereas candlestick analysis focuses on individual candlesticks, candlestick pattern analysis incorporates multiple candlesticks. Of course, profitable trading requires more than just the ability to recognize and interpret candlestick patterns.
They really only give you part of the story—a story you’ll have to interpret for yourself.
To do so well, there’s more to know.
- Learn Candlesticks. Japanese candlesticks are the most popular graphical representations of price action used by traders. For most, they are the basis of all technical analysis.
- Learn Candlestick Patterns. Candlestick patterns are formations of more than one candlestick that often appear at inflection points in price action.
- Learn Chart Patterns. Chart patterns are even larger patterns formed over the space of many candlesticks, meaning they may have even more significant implications.
- Learn Cycles, Levels, and Trend. Assets go through cycles, as does the wider market. Within these market cycles exist important price levels and shorter-term trends.
- Learn Chart Markup. Modern trading platforms give you an array of drawing (and other) tools that markup your charts with, highlighting patterns, levels, trends, and more.
- Find Indicators You Like. There are dozens of popular tools known as “indicators” you can use to supply additional information to your analysis. You can even create your own custom ones.
- Understand Your Asset. Assets move in their own unique patterns. Find an asset you’re interested in and familiarize yourself with the way its price moves.
- Choose Your Time Frame(s). The time frames you choose to trade over have a massive impact on your style of trading, as well as your risk:reward profile.
Put price action into the proper context first.
Then you can incorporate it into a fully fleshed out trading strategy.
Creating (and Executing) a Profitable Trading Strategy
From here, you can turn theory into execution.
There are two basic ways you can use candlestick patterns in your trading.
- Idea Generator – Patterns are looked at as signals. So if you identify one, it only makes sense that you’d consider trading that signal. Spot a bullish reversal signal? Go long. Find a bearish continuation signal? Add to your short.
- Confirmation Tool – Many traders use an indicator (or set of indicators) to hunt for potential trades. Then they look for candlestick patterns or other signals to act as an additional point of confirmation before entering (or exiting) a trade.
Since candlestick patterns do not have standardized price targets or measured moves, we’d generally recommend #2.
However, one of the advantages of candlestick patterns is their programmability. This not only puts you on the side of the crowd as mentioned earlier, but it also allows you to automate your trades. Just make sure you fine-tune your rules and monitor closely.
Regardless, you’ll need more to maximize profitability.
- Learn the (Basic) Math. Growing by percentage takes some getting used to. Luckily, you only need to understand the basics of the math; your trading tools can handle the rest.
- Understand Order Types. There are a variety of different ways to place orders on the market. Learn how to execute orders on your trading platform of choice.
- Develop Your Edge. There are an infinite number of potential winning trading strategies. So come up with trading ideas. Then: Backtest! Backtest! Backtest!
- Learn How to Manage Risk. This is how you turn good strategies into profitable trades. Knowing how to get in and out of the market may be trading’s most important skill.
- Master Your Psychology. If you want to be able to win consistently, you have to remove the emotions from your trades. Set rules and stick to them.
- Consider Options. Learn one of the preferred trading methods of professional traders. Gain access to advanced order types and risk mitigation strategies.
- Consider Automation. You can translate your most profitable strategies into code that executes your orders automatically. This opens another world of possibilities.
We know, it isn’t simple. Yet it can help you reach financial freedom.
Takeaways
Look at you, making progress on your trading journey.
First, familiar yourself with the terminology. Then, familiarize yourself with reading the charts. Lastly, familiarize yourself with making trades.
Candlestick patterns are one of the simplest but most effective signals you can use. That’s why we’ve gone into such depth on how to read and trade them.
To review:
- Components of Candlestick Patterns
- What Candlestick Patterns Mean
- Types of Candlestick Patterns
- Where Candlestick Patterns Fit
- How To Trade Candlestick Patterns
There is still plenty to learn but you’re making great progress.
Have questions or more information to add? Contribute to the conversation in the comments below! Or, if you know someone who could benefit from this post, share it with them. Then expand your trading arsenal by reviewing our Candlestick Patterns List.