So you want to learn about indecision candlesticks, huh? Smart choice. Recognizing signs of indecision in the market is a useful skill all traders...
Candlestick Charts
Playing Markets
Bullish Candlesticks
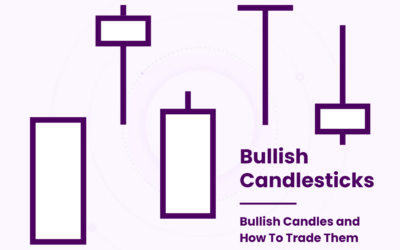
So you want to learn about bullish candlesticks, huh? Smart choice. Recognizing signs of bullish conditions in the market is a useful skill all...
Bearish Candlesticks
So you want to learn about bearish candlesticks, huh? Smart choice. Recognizing signs of bearish conditions in the market is a useful skill all...
Candlestick Types
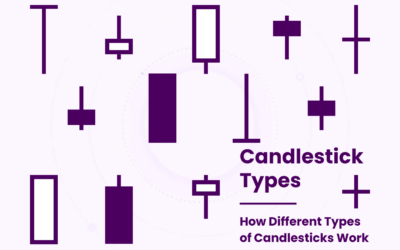
So you want to learn all the candlestick types, huh? Smart choice. Distinguishing between the different types of candlesticks is a useful skill all...
Spinning Top Candlesticks
Spinning Top candlesticks are one of the most famous types of candlesticks for good reason. Japanese candlesticks are the basic building block of...
Long-Legged Doji Candlesticks
Long-Legged Doji candlesticks are one of the most famous types of candlesticks for good reason. Japanese candlesticks are the basic building block...
Long Candlesticks
Long Candle candlesticks are one of the most famous types of candlesticks for good reason. Japanese candlesticks are the basic building block of...
Inverted Hammer Candlesticks
Inverted Hammer candlesticks are one of the most famous types of candlesticks for good reason. Japanese candlesticks are the basic building block of...
Hanging Man Candlesticks
Hanging Man candlesticks are one of the most famous types of candlesticks for good reason. Japanese candlesticks are the basic building block of...
Marubozu Candlesticks
Marubozu candlesticks are one of the most famous types of candlesticks for good reason. Japanese candlesticks are the basic building block of most...
Gravestone Doji Candlesticks
Gravestone Doji candlesticks are one of the most famous types of candlesticks for good reason. Japanese candlesticks are the basic building block of...
Dragonfly Doji Candlesticks
Dragonfly Doji candlesticks are one of the most famous types of candlesticks for good reason. Japanese candlesticks are the basic building block of...


