Candlestick Types
Playing Markets
Understanding Candlestick Charts
Japanese candlestick charts are the foundation of conventional technical analysis. Thus, learning to read the story in the charts is a skill all traders must master.
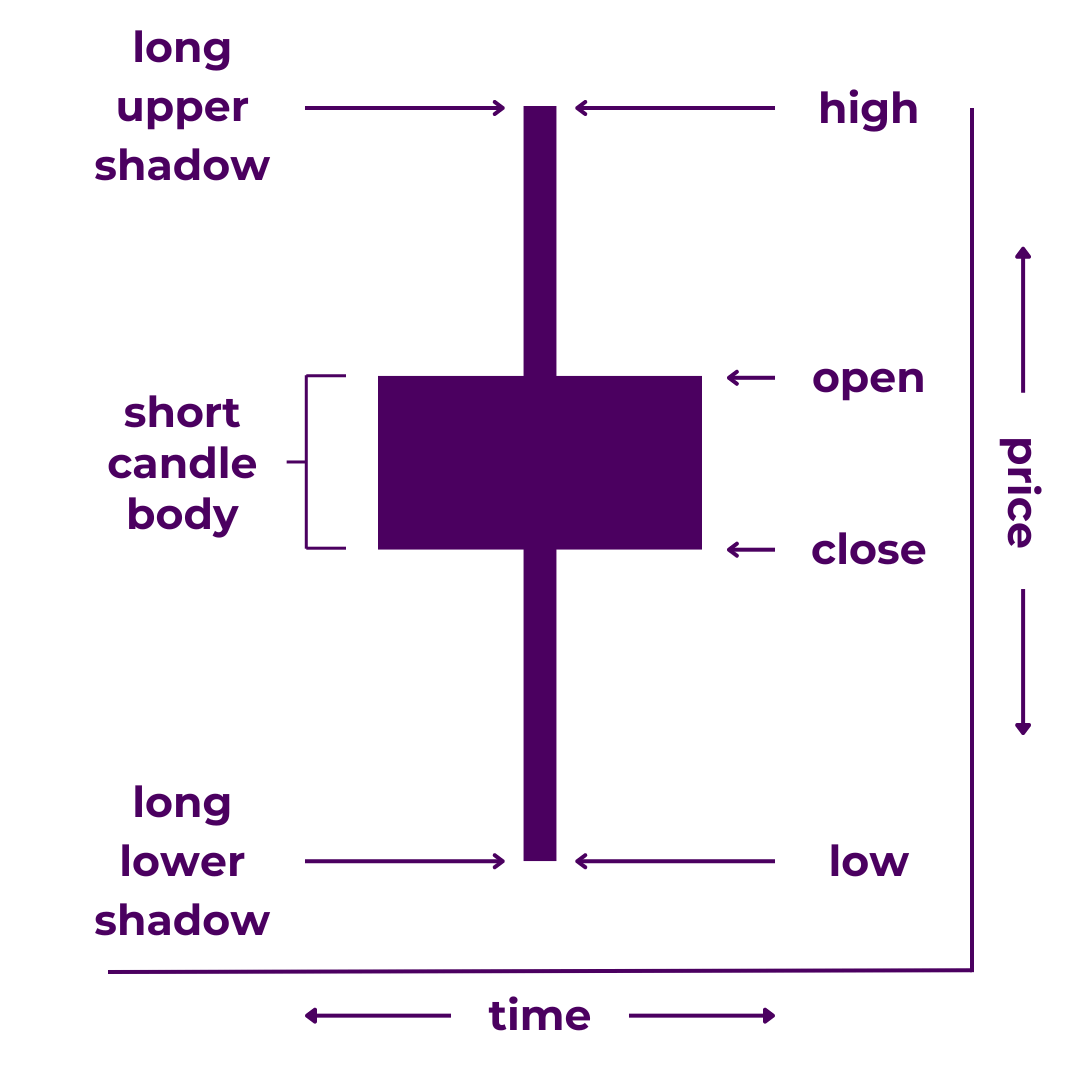
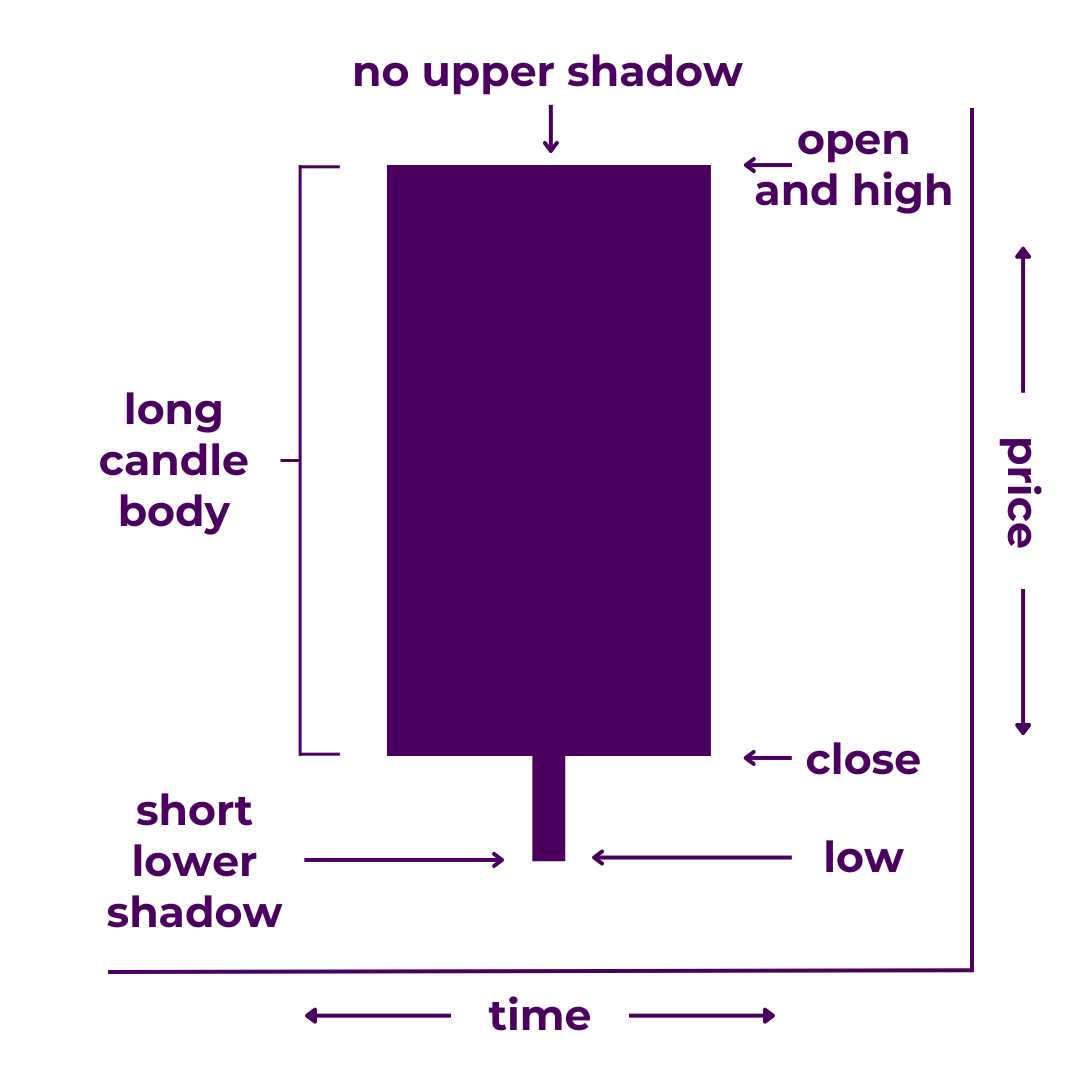
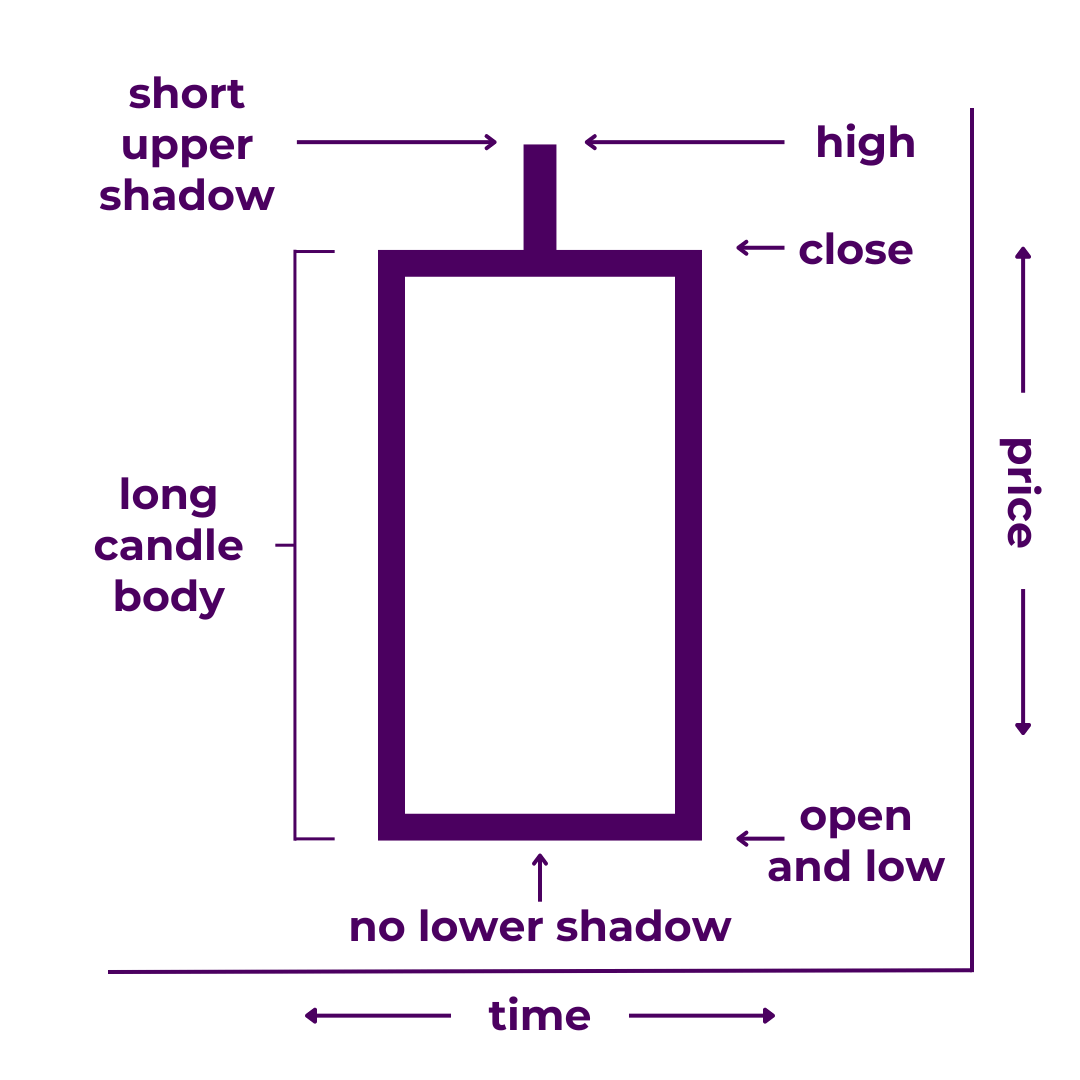
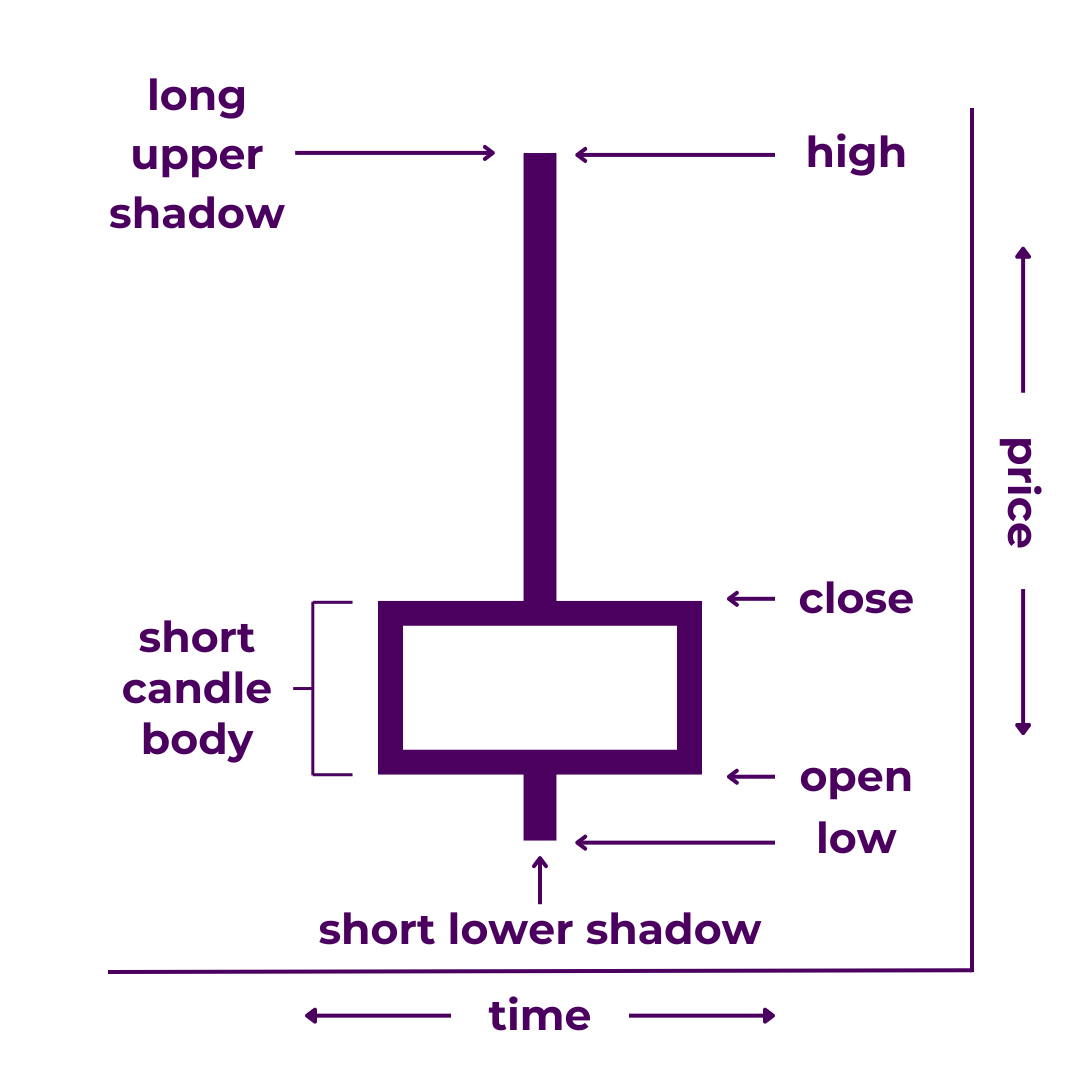
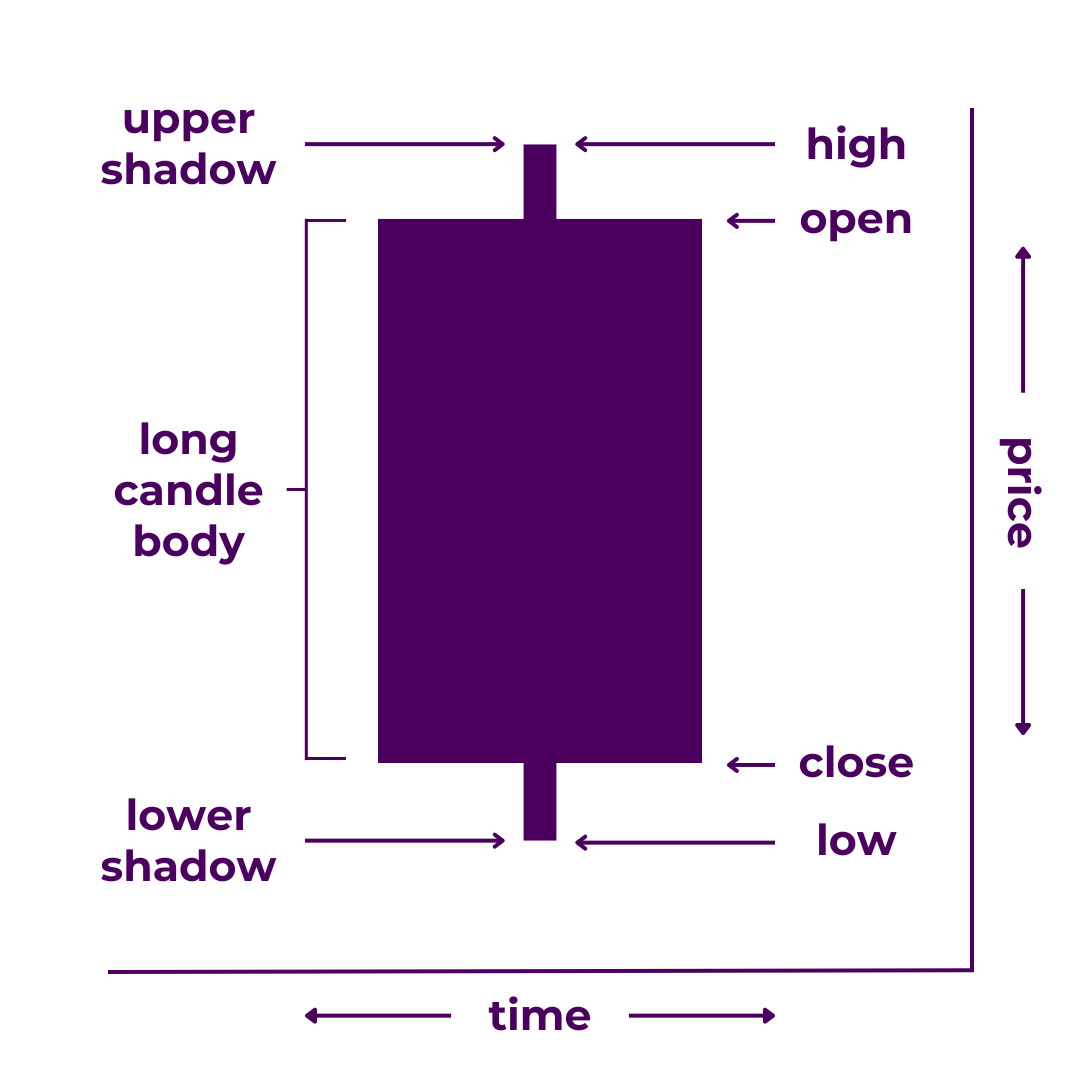
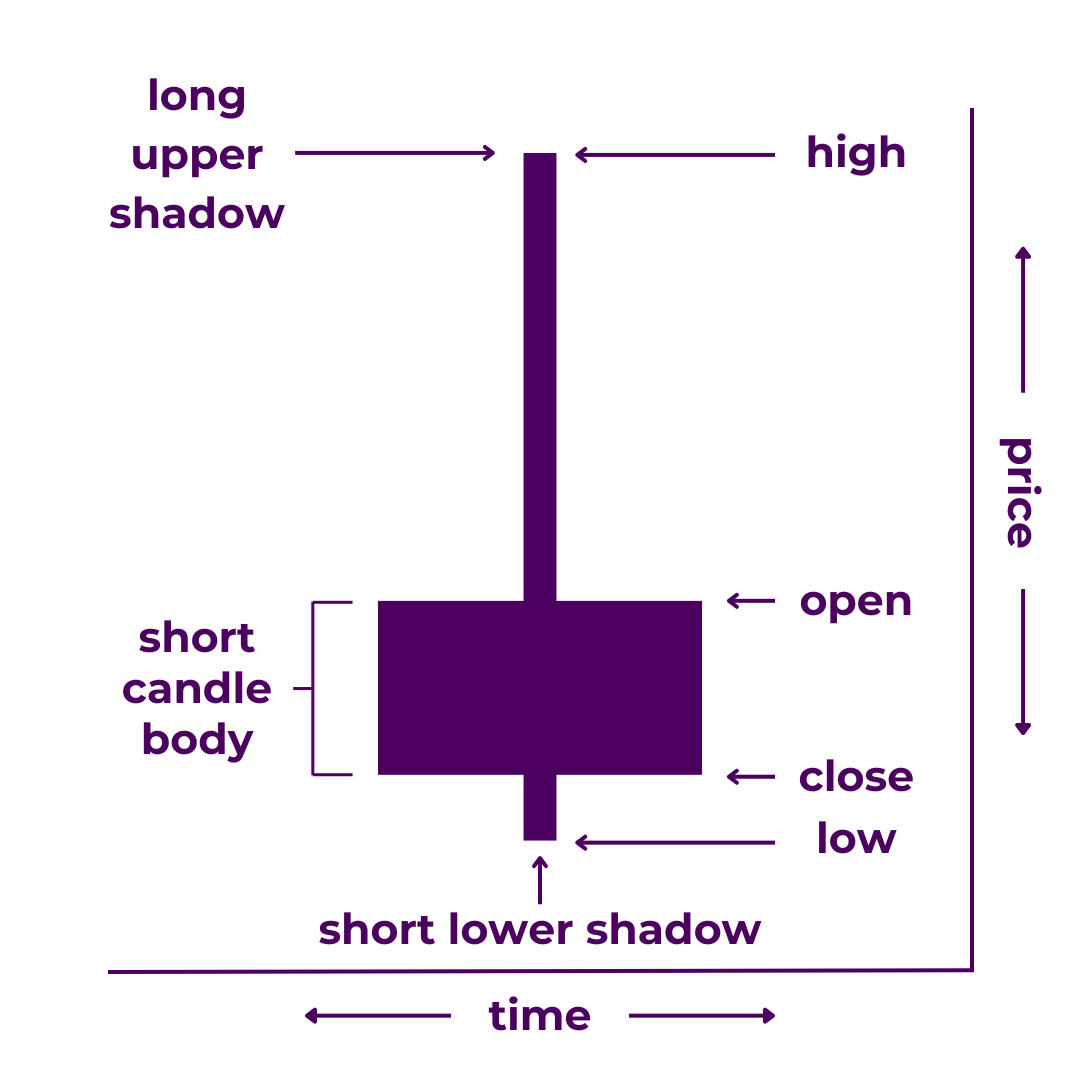
At the simplest level, a candlestick outlines the open, close, high, and low prices during a given time period. At a more complex level, they reveal much more.
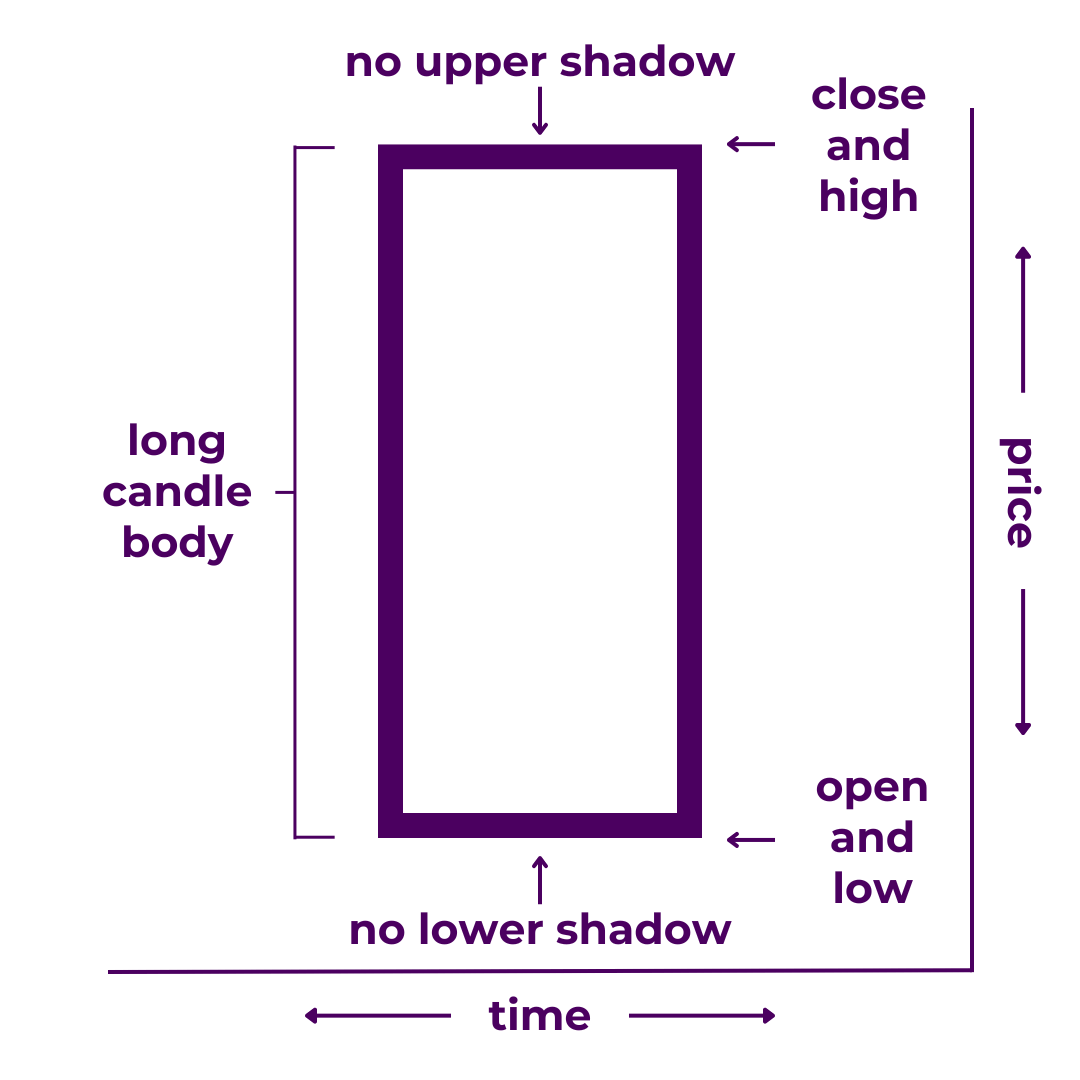
Bearish Belt-Hold
Bullish Belt-Hold
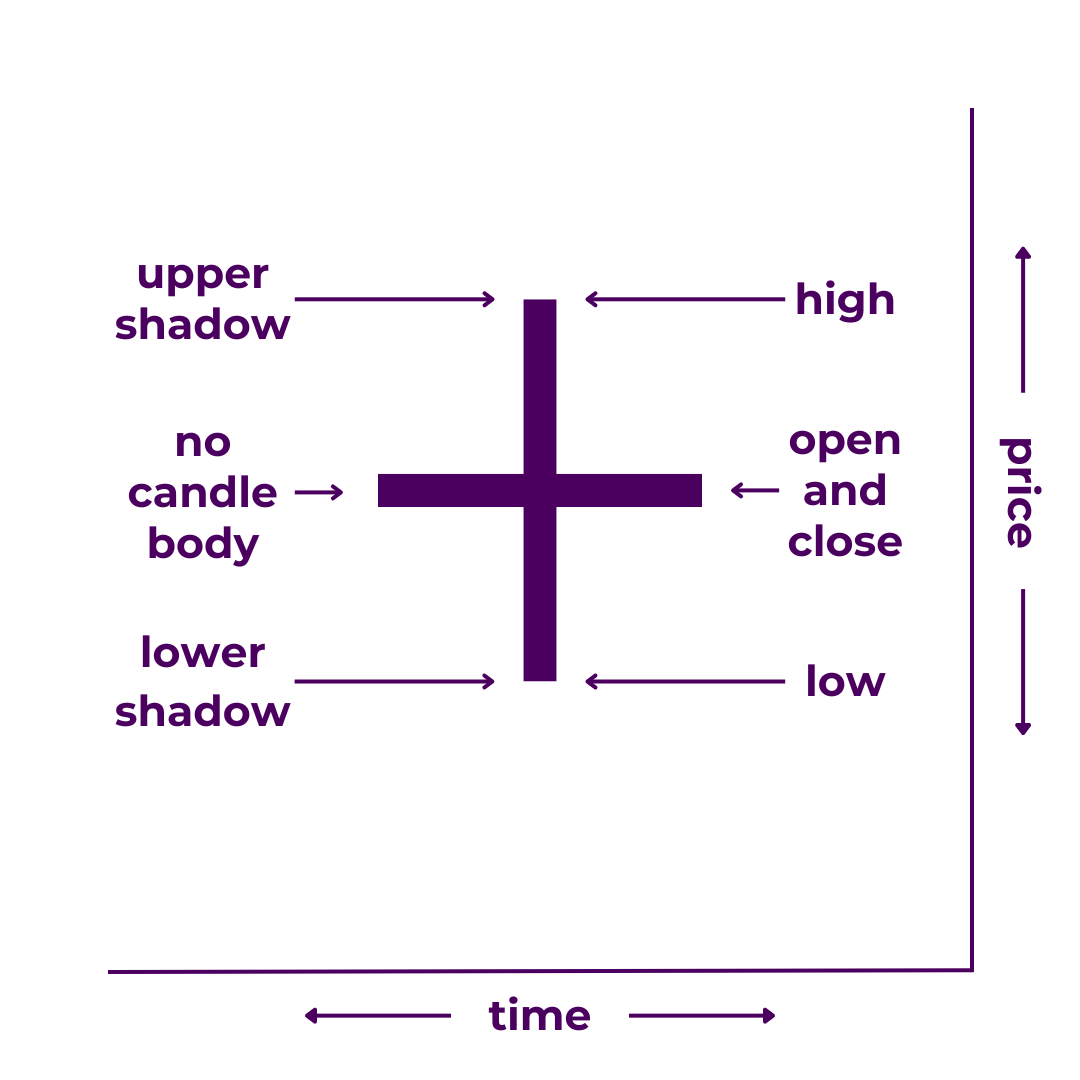
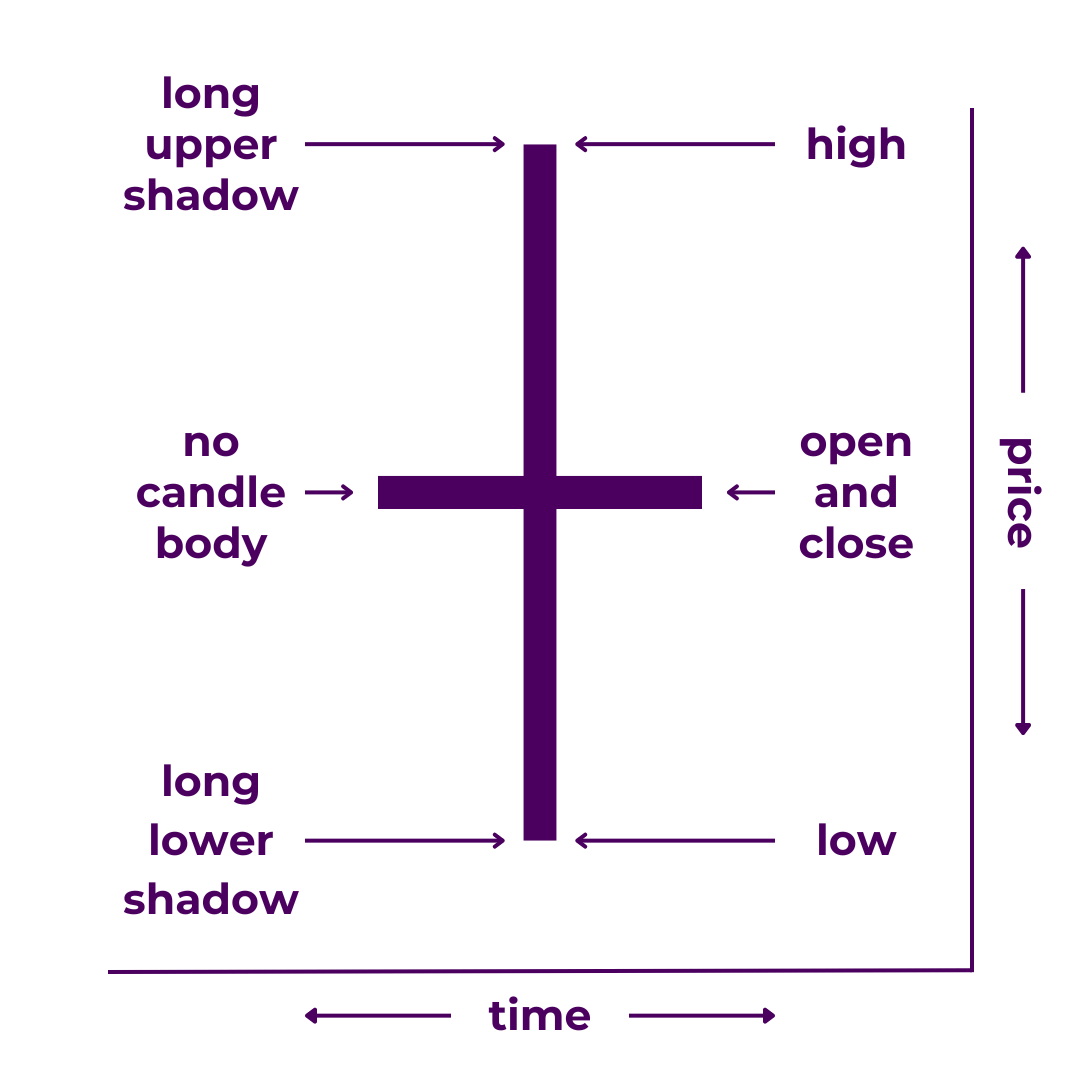
Doji
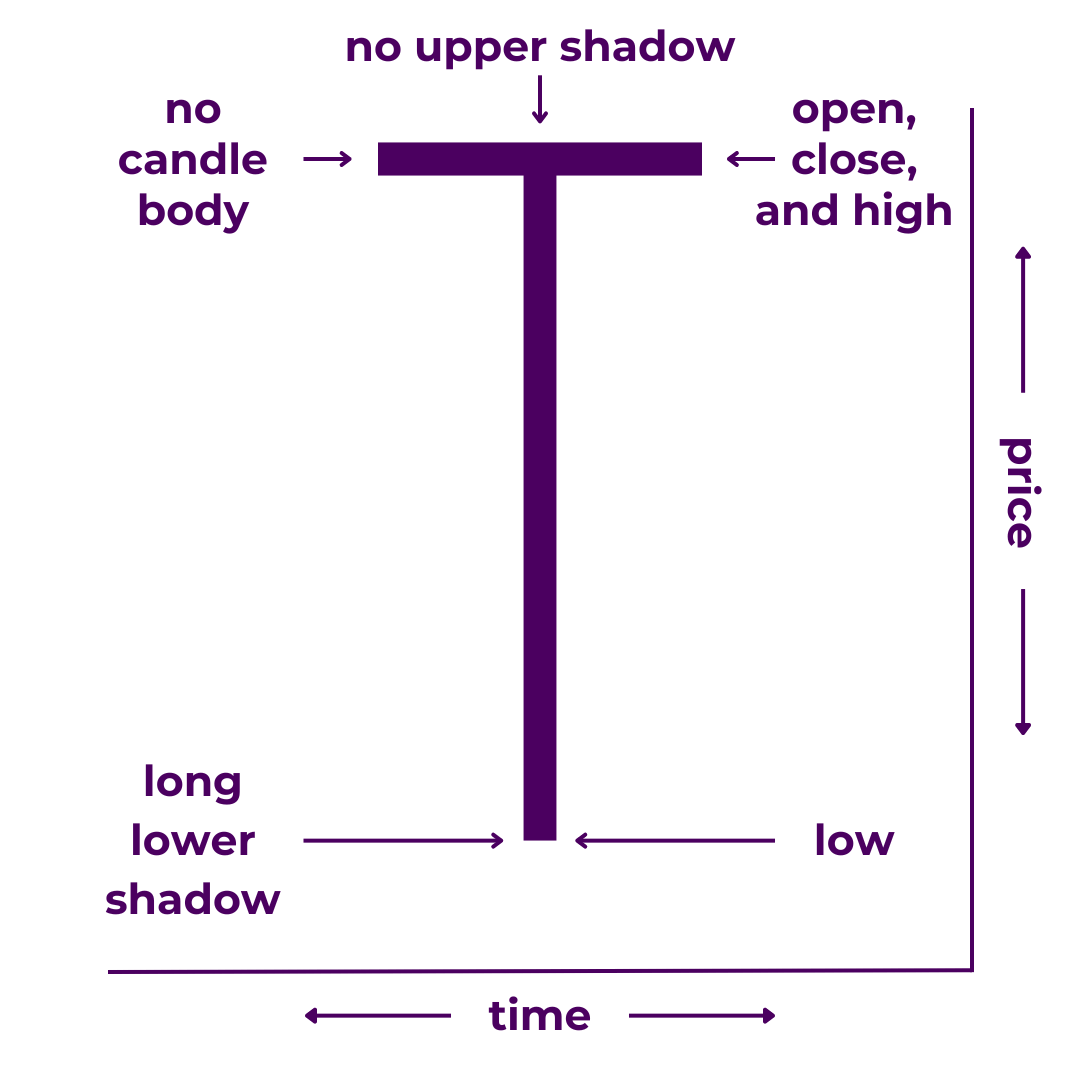
Dragonfly Doji
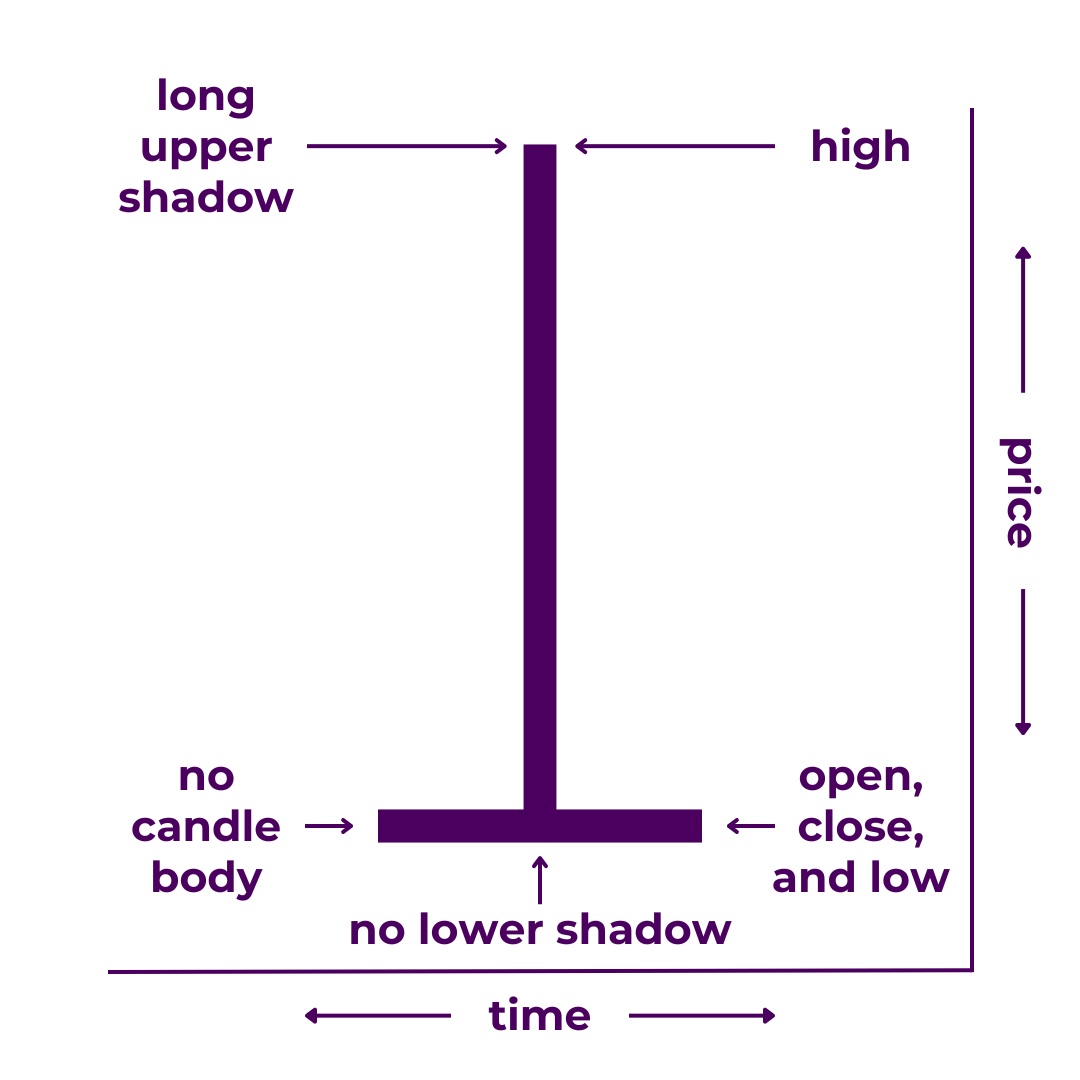
Gravestone Doji
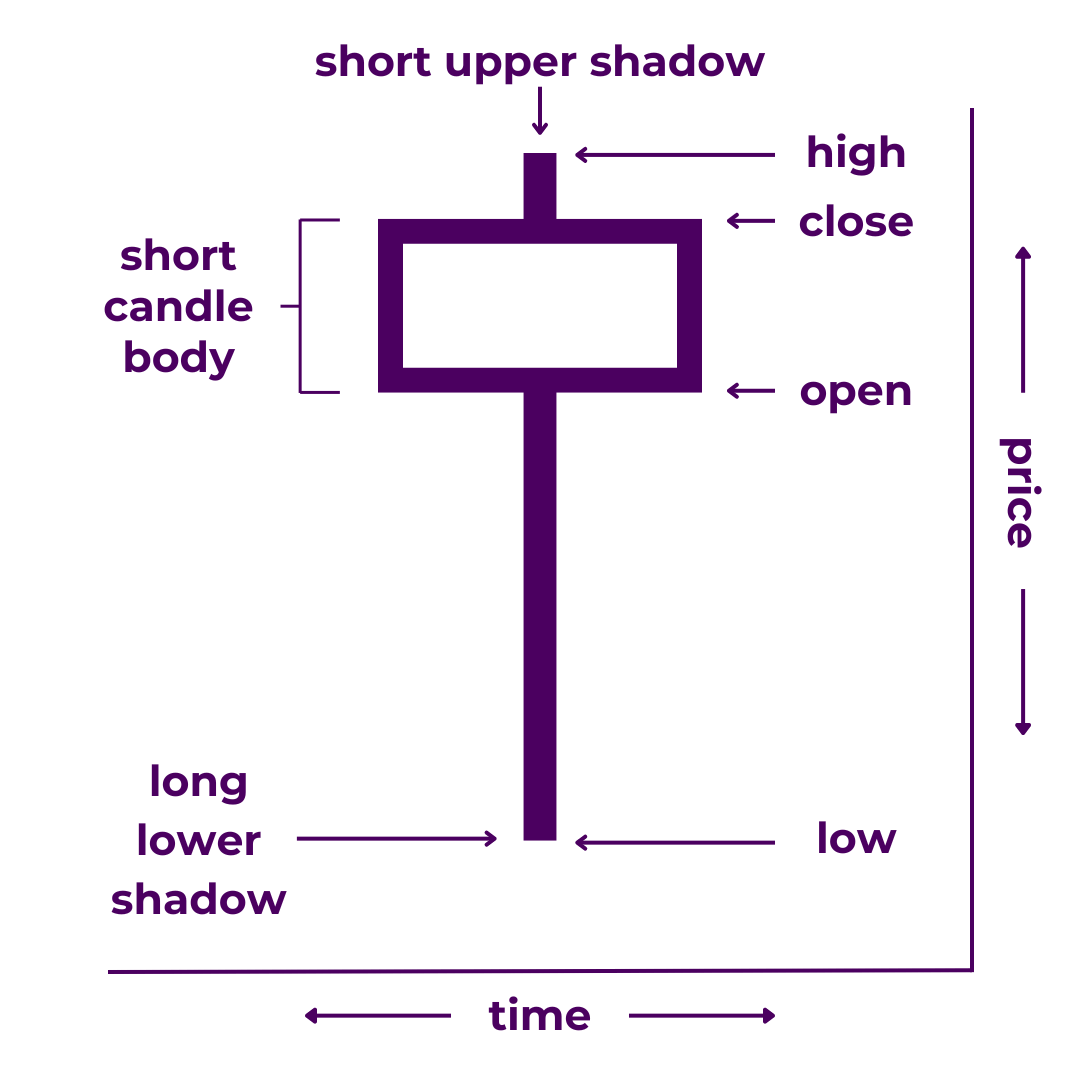
Hammer
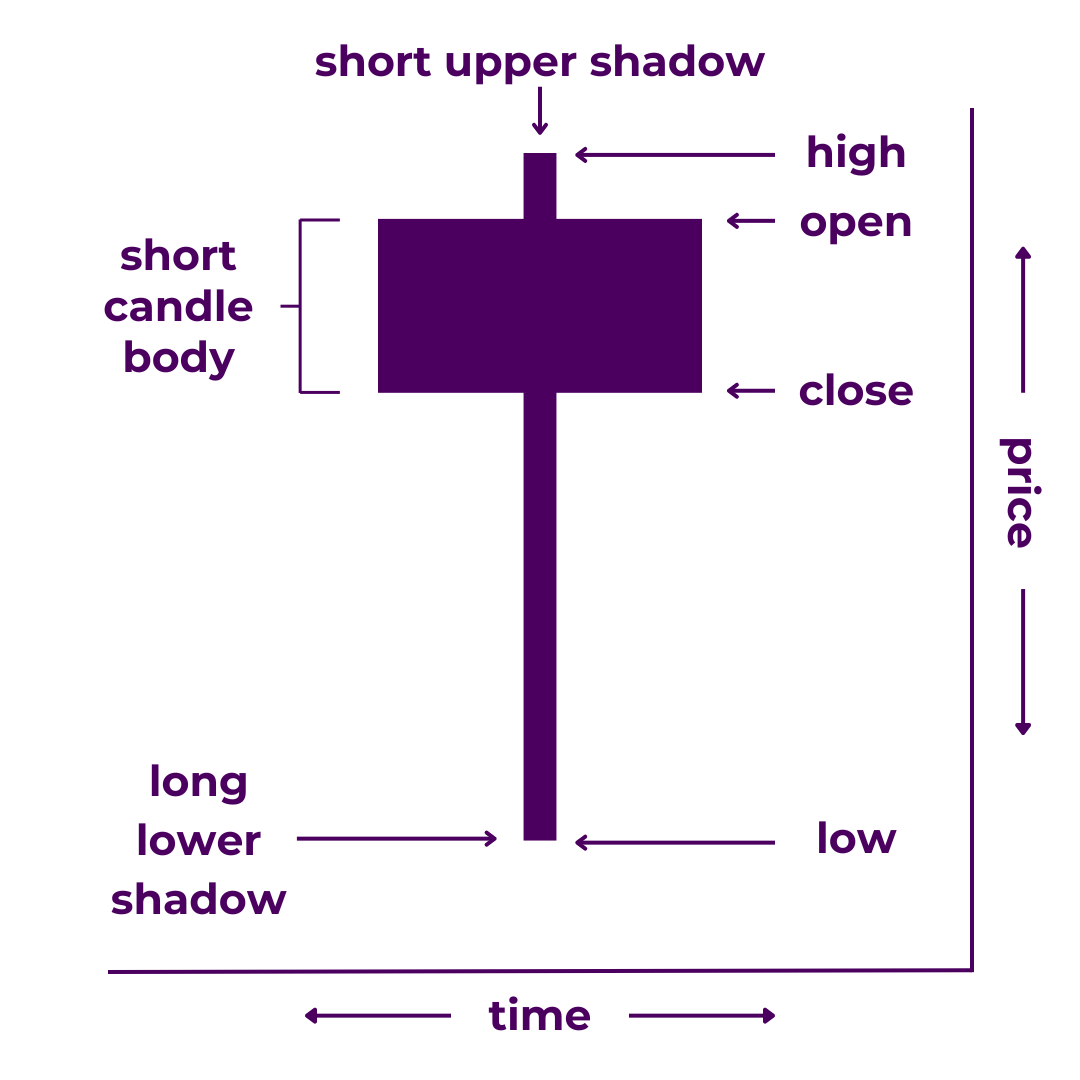
Hanging Man
Inverted Hammer
Long
Long-Legged Doji
Marubozu
Shooting Star