Bullish belt hold candlesticks are one of the most famous types of candlesticks for good reason.
Japanese candlesticks are the basic building block of most technical analysis. That makes the ability to recognize different candlestick types a crucial trading skill.
In this Guide to Bullish Belt Hold Candlesticks, we’ll explain:
First though, let’s start with a definition.
What Is a Bullish Belt Hold Candlestick?
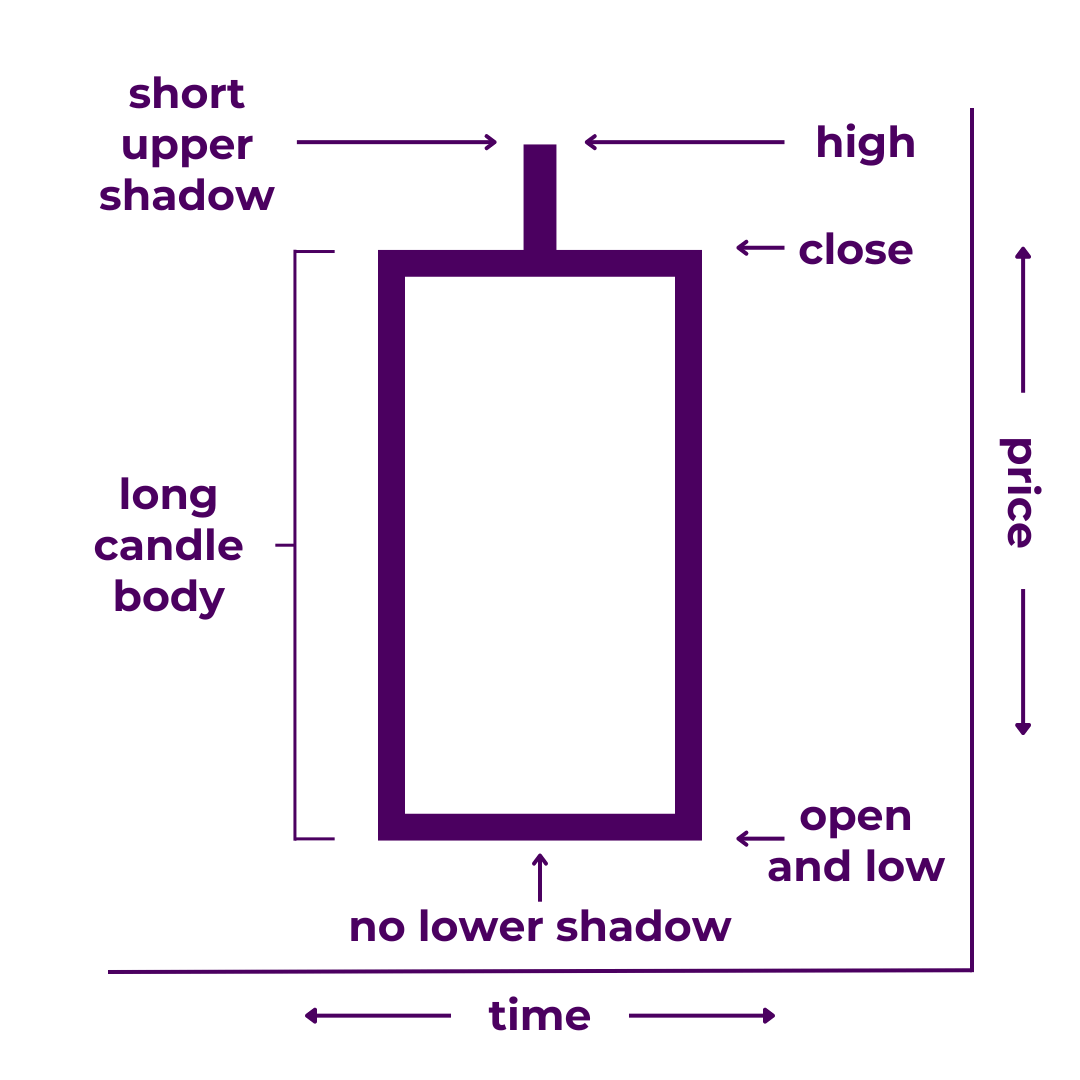
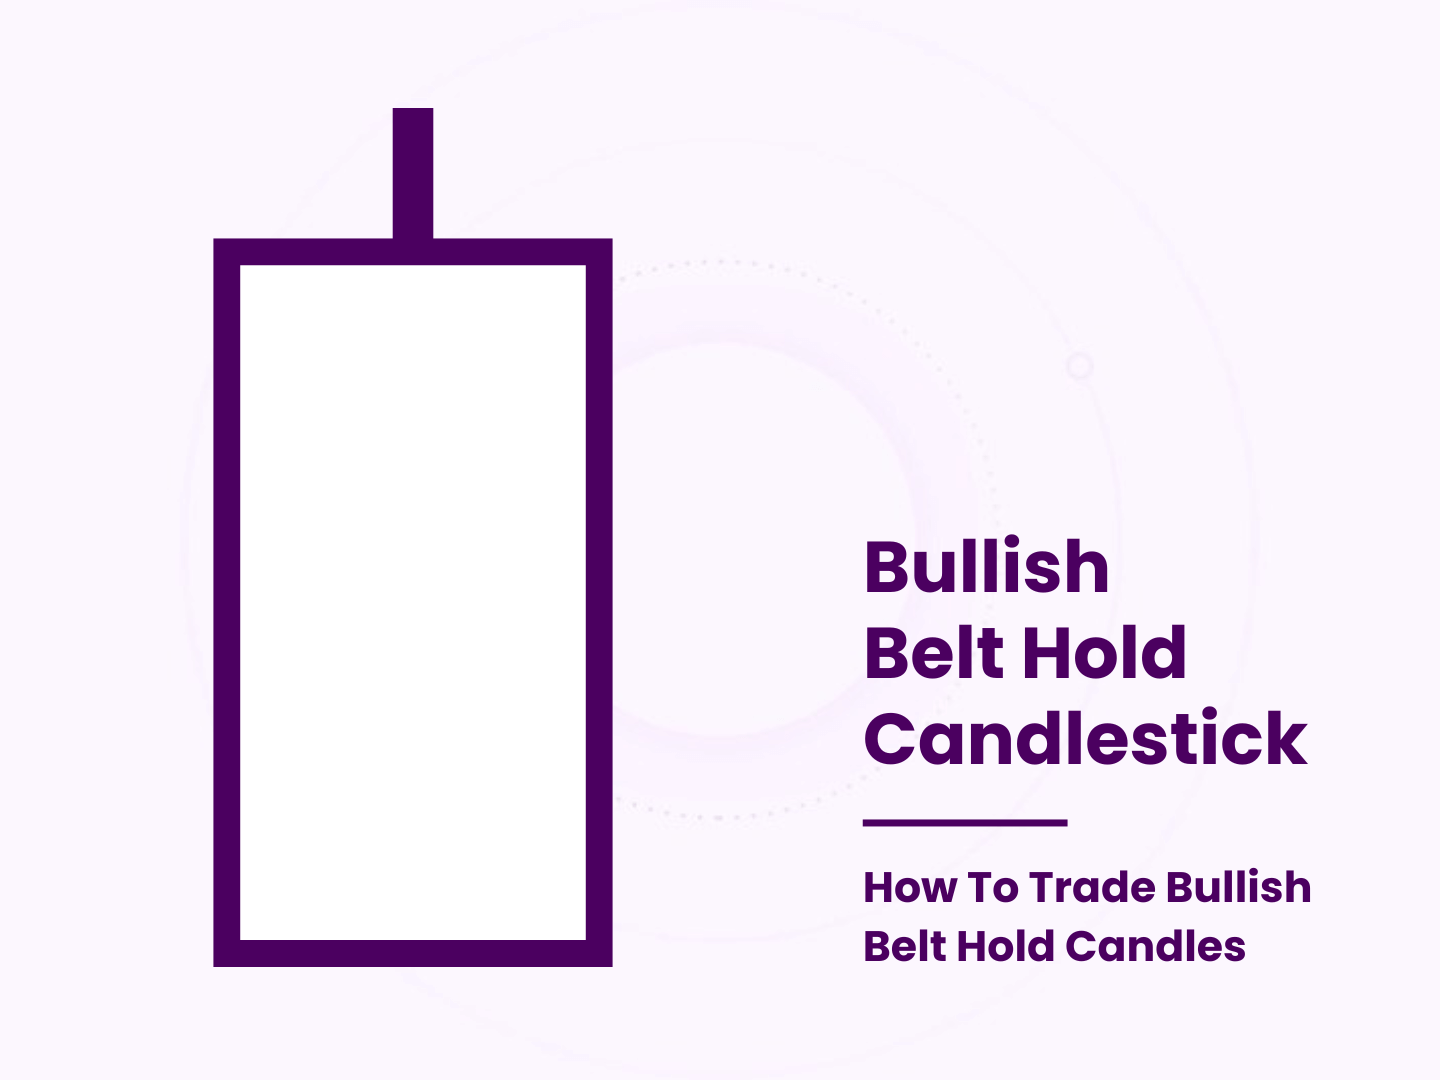
A bullish belt hold (or “yorikiri”) is a long candlestick with a short upper shadow and no lower shadow. It indicates that the open and low prices match and are far below the close and high prices. Bearish belt hold candlesticks are commonly seen during peak volatility, trending moves, and reversals.

Yorikiri candlesticks seem to get their moniker from the sumo wrestling technique of the same name. It means “frontal force out” in Japanese. We are not 100% sure how this relates to candlesticks. It seems to be because one side is pushing the other side back a great distance, but not totally without resistance.
(If you know the true meaning, please leave it in the comments below).
In trading terms, a bullish yorikiri shows that the price rose from the open considerably and closed near the high for that time period. This makes it the opposite of a bearish belt hold.
This type of candlestick paints a picture of near-total dominance. On the chart, it looks like non-stop price movement for an entire period. With such a large body, the color of the candle always stands out. You can almost hear the bulls cheering, “We’ve got them on the ropes!” while the bears cry, “Please, no more!”
Technically, bullish yorikiri should not have a lower wick at all. Some traders may even attempt to assign criteria to the length of the body or lower wick. For most though, this is total overkill. One little wick is not going to make or break your trade. Whether it’s a yorikiri, marubozu, or any other type of long candle, you can generally treat them the same.
What’s more:
Some traders contend that it’s not officially a bullish belt hold unless it appears at the end of a downtrend, signaling a bullish reversal—which would make it more of a multi-candlestick pattern.
Regardless, you probably shouldn’t concern yourself with what to call any given candle. It’s just not that important. What matters is what it means for your trades.
We’ll get into how to trade bullish belt hold candles in a moment.
First, let’s illustrate how they are formed.
How Are Bullish Belt Hold Candles Formed?
Bullish belt holds give the impression of one-way price action.
However, that is not always how it plays out.
Within the time period of the candle, price action is often more volatile than the yorikiri may suggest. For example, a bullish yorikiri on a daily chart shows that the bulls won the day, but they may not have been in control all day. You’d need shorter timeframes to see a more complete picture.
That’s also why you should usually wait for confirmation. It’s not officially a bullish belt hold until the candle closes. And it can be dangerous to make trades based on incomplete candles.
You can never be 100% sure how a candlestick will look at the end of the time period.
That’s one of the reasons it’s so important not to get too focused on any single candle.
Where Bullish Belt Hold Candlesticks Fit in the Chart Narrative
The markets are often characterized as a battle between the bulls and the bears.
Bullish belt holds indicate that the bulls are clearly winning (or at least won over the time period that candle represents). Obviously, no single candlestick can determine an entire trend. Still, yorikiri that appear at the right time can have significant implications on future price action.
Be on the lookout for them during:
- Volatile Periods – Volatility makes for more dramatic price action, increasing the probability of all types of long candles.
- Trending Moves – Yorikiri may be most common during heavily trending moves, especially so-called “exponential” ones.
- Reversals – Bullish belt hold candlesticks frequently appear before, during, or after a change in the direction of trend.
They may also appear in certain types of candlestick patterns.
To become a successful trader, understanding candlesticks is a great place to start. But you should also learn how candlestick patterns and chart patterns work. Plus, you need to be able to recognize cycles, trends, and price levels. From there, you can begin to read the story in the charts.
Tools like chart markup and trading indicators can reveal even more. And once you’ve chosen your asset(s) and trading style, the full chart narrative truly comes into focus. The charts will basically speak to you at this point.
By looking at the history of the chart, you can identify how price action played out around prior bullish belt hold candles (or patterns that included them). Moreover, you can compare historical structures in price and your other tools to current price action.
Now, you’re actually doing real technical analysis.
How To Trade Bullish Belt Hold Candles
You should never trade based on a single candlestick.
However, certain candle shapes may give you some trading ideas, especially given the right context. Bullish belt hold candlesticks are one of those shapes.
In addition to the overall structure surrounding a bullish belt hold, there are some other things worth paying attention to.
- Trading Volume – The greater the trading volume during any candlestick’s formation, the greater its potential implications on price action.
- Candle Size – Larger candles often signify important changes to market conditions, such as shifting support and resistance.
- Price Formations – The open, close, or low of bearish belt holds may help establish the strength of price levels and trend lines.
- Breakouts – Price formations often resolve with powerful price action that includes dramatic-looking candles like yorikiri.
Generally, the fewer of these factors that are present, the less noteworthy the candle. Additionally, when looking at time periods where bullish belt holds are common (ie. the 1-minute chart of a volatile asset), you should usually give their appearance less weight in your analysis.
In order to form a complete trading strategy, you need to understand the basic math of trading, order types, and trading psychology. Even more importantly, you need to develop your own edge and learn risk management. And if you really want to take it all the way, look into options and trading automation.
Before you get there though, there’s still more to learn about the candles themselves.
Other Types of Candlesticks
The bullish belt hold candlestick is but one of many candlestick types.
You’d be wise to get familiar with all of the other ones too.
- Bearish Belt Hold
- Doji
- Dragonfly Doji
- Gravestone Doji
- Hammer
- Hanging Man
- Inverted Hammer
- Long Candle
- Long-Legged Doji
- Marubozu
- Shooting Star
- Spinning Top
Not all candlesticks shapes earn names. So you should probably check out the ones that do. Just keep in mind that it’s not necessarily about memorizing all of the ins-and-outs of each. It’s more about ingraining the principles of price action into your brain.
In fact, you’re free to forget all of the names as long as you can look at a candlestick and understand what it means.
Takeaways
To review:
Bullish belt hold candlesticks are a type of candlestick that signals dominance for the bulls. They tend to show up during periods of high volatility, trending moves, and reversals. That means they can help you find winning trades.
Of course, there are other types of candlesticks that you should learn about. And even so, candlestick analysis alone is not enough to trade successfully long-term.
Nonetheless, you’ve now added one more tool to your toolkit.
Have questions or more information to add? Contribute to the conversation in the comments below! Or, if you know someone who could benefit from this post, share it with them. You can also check out our Japanese Candlesticks Guide to improve your candlestick analysis skills.


0 Comments