Bullish on neck patterns are fairly rare but give a clear signal.
Since candlesticks are the basic building block of most technical analysis, the ability to recognize different candlestick patterns is a crucial trading skill.
In this Guide to Bullish On Neck Patterns, we’ll explain:
First though, let’s start with a definition.
What Is a Bullish On Neck Pattern?
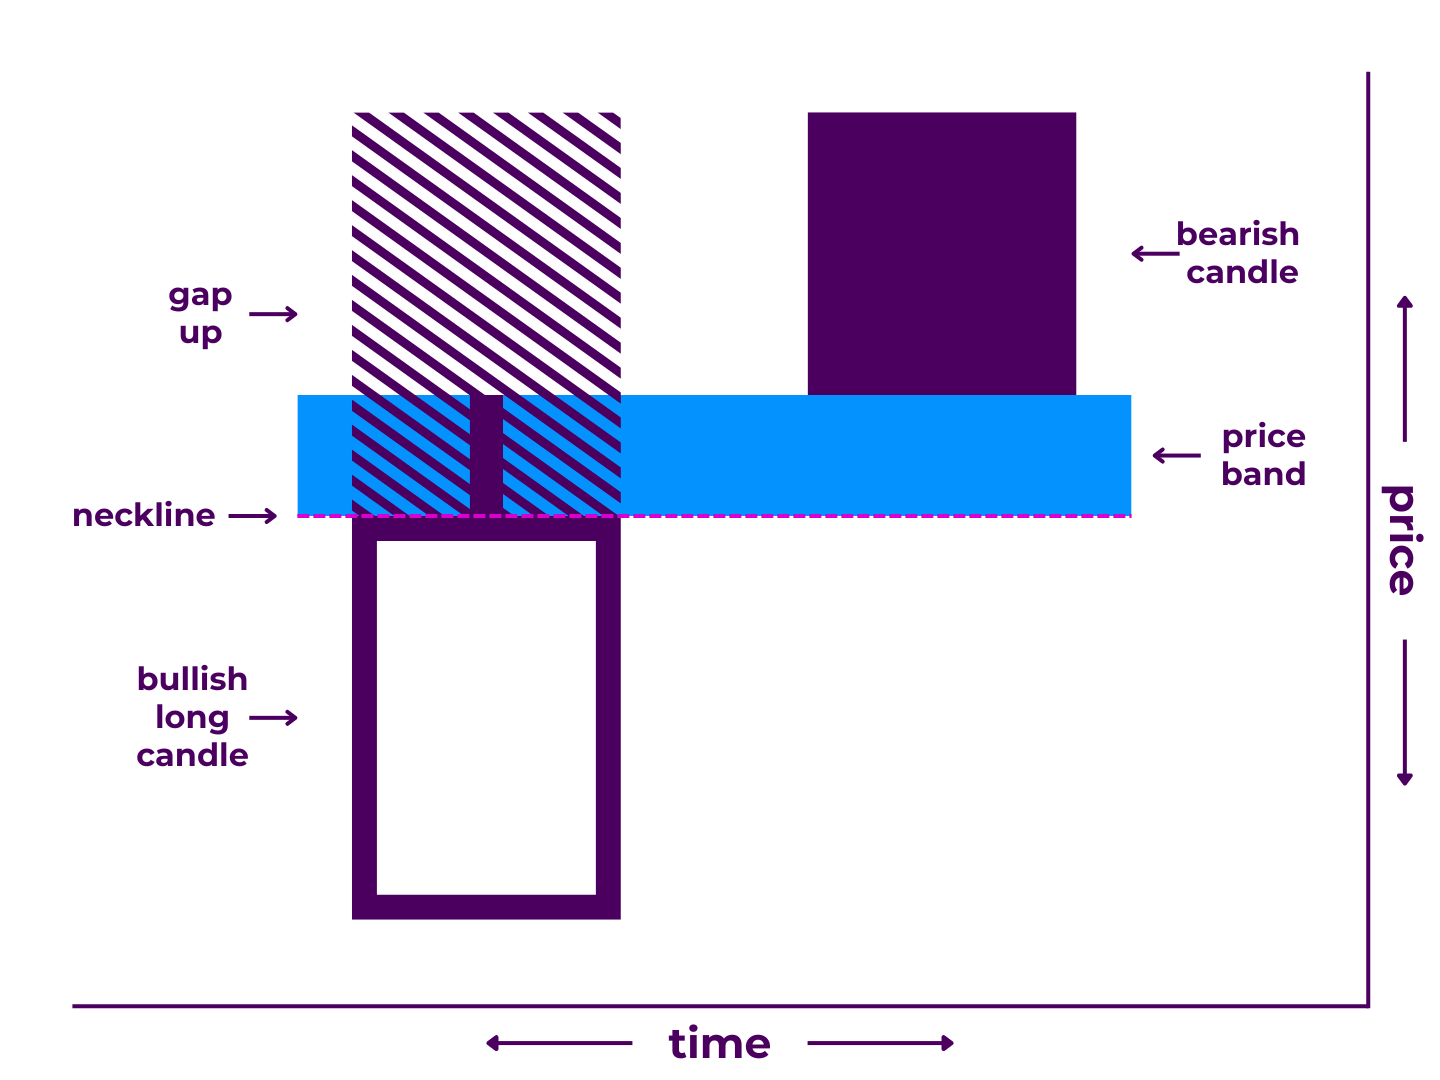
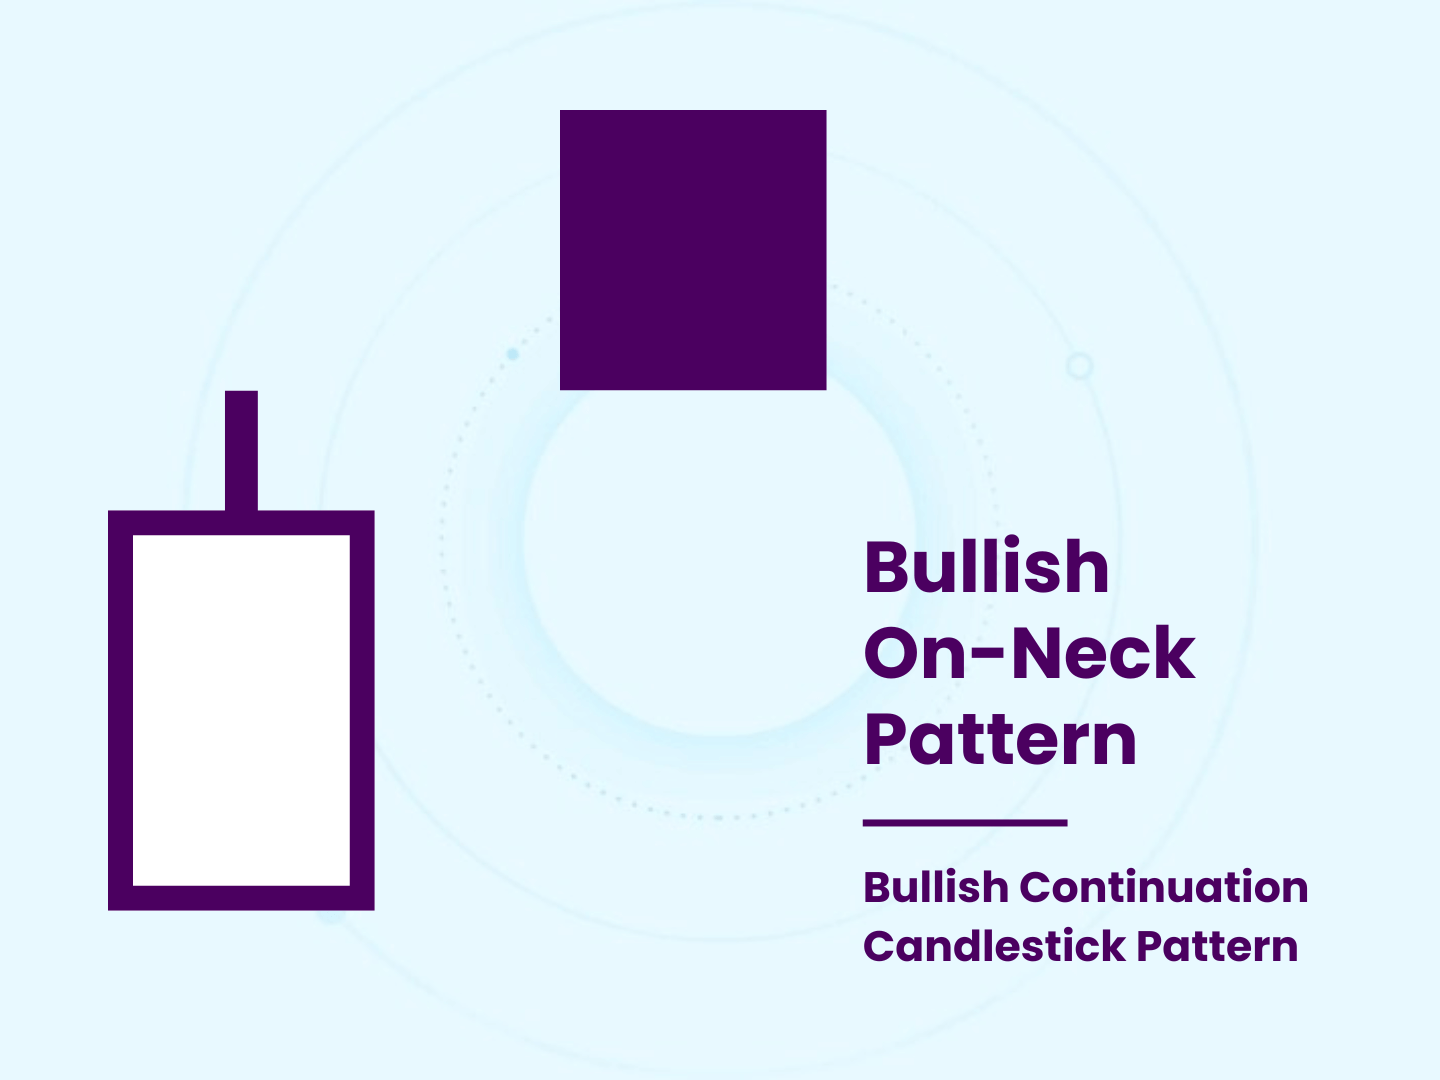
A bullish on neck pattern is a 2-candlestick formation that may signal a bullish continuation. It may appear in an uptrend and is made up of a large bullish candle followed by a gap up and a smaller bearish candle that partially fills the gap and closes near the high of the previous candle.

It is the bullish version of the on neck pattern, making it the opposite of the bearish on neck. It is also very similar to the bullish in neck and bearish counterattack lines patterns in that the closes of the two candles create a make-or-break price band that could shape upcoming price action.
Of course, no candlestick pattern guarantees a particular outcome. Instead, they offer clues as to what is going on in the market.
So the question is, what does an on neck really tell you?
What Bullish On Neck Patterns Mean
Like many candlestick patterns, the name itself doesn’t reveal much.
And unlike some, English speakers do not use the Japanese name for it. The term “on neck” refers to the “neckline” created by the closes of the two candles. If the bears cannot hold this price band, it is implied that the uptrend will continue.
In trading terms:
- During the first period, price continued the pre-existing uptrend.
- The second period opened with a gap up above the first period’s high, then moved back down, partially filled the gap, and closed at the same price as the first period’s high.
This sets the stage for bullish continuation, as the failure to fill the gap completely may indicate that selling pressure is still weak.
How To Recognize Bullish On Neck Candlestick Patterns
Traders are attracted to patterns partly because they are easy to spot.
However, it’s also easy to see things on the charts that aren’t truly there (or anticipate events that never come to fruition). That’s one of the reasons why waiting for confirmation is so important.
Technically, a bullish on neck pattern must:
- Appear during an uptrend
- Begin with a bullish long candle that has an upper wick, such as a bullish belt hold.
- Have a gap up after the first candle that exceeds the upper wick of the first candle
- End with a bearish candle that partially fills the gap and closes even with the upper wick of the first candle
In practicality though, many traders will make various exceptions.
- The first candle doesn’t necessarily have to be a long candle, as long as its body is longer than the body of the second candle.
- The first candle doesn’t necessarily have to have an upper wick, as long as there is a gap that is only partially filled by the next candle.
- The close of the second candle candle be slightly above or below the upper wick of the first candle, as long as it does not get too near the close of the first candle.
- It can take two candles to reach the upper wick of the first candle, as long as the combined body length of the second and third candles is shorter than the body of the first candle.
Depending on who you ask, any of these standards may be more or less important. Moreover, some of these variations may be more properly classified as other candlestick patterns, such as the bullish in neck or bearish counterattack lines.
Remember, identifying the continuation itself is more important than labeling the formation. That’s not to say these standards are completely unimportant (as we’ll touch on shortly). It’s just to say that the implications are more important than the criteria.
In other words, you need to put it into context.
Where Bullish On Necks Fit in the Chart Narrative
The markets are often characterized as a battle between the bulls and the bears.
Bullish on neck patterns show that the bulls attempted to press their advantage on candle one and between candles one and two, then held their ground fairly well over the course of candle two.
On the chart, it looks like a veritable “no man’s land” between battle lines.
It might happen like this on a daily time frame:
As a part of an upward trending move, day one saw price surge higher. This movement was sustained overnight. As traders awoke to a price gap, some of the bulls saw it as an opportunity to take profits. Once trading resumed on day two, they did so, which allowed for a small correction. However, the selling pressure was so weak that the gap was only filled halfway. Ultimately, price settled at the high of the previous day.
From here, the bulls smell blood in the water as the bears cling to the slimmest hope.
In the short-term, it amounts to a mustering line.
The question traders need to ask themselves is, “Can the bears make a push back across no-man’s land or will the bulls keep their boots on their necks?”
To answer that question, you’ll need more than just an understanding of Japanese candlesticks and candlestick patterns. You’ll want to analyze both within the context of greater chart patterns as well as trend and price levels. You’ll also want to make use of your own chart markup and indicators.
Analyze the history of your preferred asset(s) with respect to on neck patterns and apply it to your own trading style.
Now, you can test (and/or stretch) the criteria we mentioned above to find the most tradeable opportunities. For example, you may find that bullish on necks with shooting star second candles play out more reliably than those with other candlestick types. Or, you may find the opposite.
Here is where the story in the charts begins to come into focus.
This is what we call technical analysis.
How To Trade Bullish On Neck Patterns
Bullish continuation points are great places to add to your long position or move your stop loss up.
Bullish on neck patterns serve as easy-to-spot signs of potential bullish continuation that may serve as a launch point for the next big leg up.
Generally, you can put more weight into multi-stick patterns than single candles. They give you more information over a longer amount of time. Still, it is considered unwise to trade based on candlestick patterns alone. They rarely have extremely high hit rates by themselves.
You need additional points of confluence to shift the probabilities in your favor.
Some of the more important ones include:
- Volume – For bullish continuation, you typically want to see low trading volume on bearish moves. That means low volume on the second candle of a bullish on-neck may be a good omen.
- Price Formations – Bullish continuation patterns like the bullish on neck tend to perform better when there is thin (or non-existent) resistance in their way. The further above and weaker the better.
- Matching Momentum – Oscillating indicators like the RSI or stochastics are commonly used to identify continuation by analyzing slope, percentile, and/or divergence.
The fewer such factors corroborating the continuation, the less confident you can be about it.
It would be difficult to form a comprehensive trading strategy around on-neck patterns (whether bullish or bearish). There simply isn’t enough there to develop a strong edge. Even with a great understanding of trading math, orders, psychology, risk management, options, and automation, you’d still have a hard time.
You’re much better off building your strategy around other tools then using continuation patterns as an additional point of confirmation.
Patterns like the on neck are much better idea givers than trade makers.
Other Candlestick Pattern Types
The bullish on neck is but one of many candlestick patterns.
You’d be wise to get familiar with all of the other ones too.
- Abandoned Baby – Bearish | Bullish
- Breakaway – Bearish | Bullish
- Counterattack Lines – Bearish | Bullish
- Doji Star – Evening | Morning
- Engulfing – Bearish | Bullish
- Gap Three Methods – Upside | Downside
- Harami – Bearish | Bullish
- Harami Cross – Bearish | Bullish
- In Neck – Bearish | Bullish
- Kicking – Down | Up
- Ladder – Top | Bottom
- Last Engulfing – Bottom | Top
- Mat Hold – Bearish | Bullish
- Matching – High | Low
- Meeting Lines – Bearish | Bullish
- Separating Lines – Bearish | Bullish
- Star – Evening | Morning
- Stomach – Below | Above
- Tasuki Gap – Downside | Upside
- Three Inside – Down | Up
- Three Methods – Falling | Rising
- Three Outside – Down | Up
- Three-Line Strike – Bullish | Bearish
- Tri-Star – Bearish | Bullish
- Tweezer – Top | Bottom
- Window – Falling | Rising
Sure, there are quite a few of them. But don’t let that intimidate you.
It’s unnecessary to memorize all the names and criteria for every pattern. What’s more important is to learn the principles of price action and technical analysis.
In fact, you’re free to forget all of the names and specifications as long as you can look at a group of candlesticks and understand what they are trying to tell you.
Takeaways
To review:
Bullish on necks are a type of candlestick pattern that signals a potential bullish continuation. While not a guarantee, their appearance may indicate that market conditions are going to remain the same. Thus, they can help you find winning trades.
Of course, there are other candlestick patterns that you should learn about. And even so, the ability to recognize patterns is not enough to trade successfully on its own.
Nonetheless, you’ve now added one more tool to your toolkit.
Have questions or more information to add? Contribute to the conversation in the comments below! Or, if you know someone who could benefit from this post, share it with them. You can also check out our Candlestick Patterns Guide to improve your candlestick analysis skills.


0 Comments